Why you need a GIS Dashboard 👨💻

Geospatial tech has come a long way since static charts and plotters. With the advent of web apps, a countless array of api tools, and web services for navigation and location, the geospatial world (much like the rest of the world) has been trending towards real time data.
Getting data in real time or based on a trigger (see Power Automate) isn't new, but reporting in real time is. That is to say, it's becoming an industry standard to have real time reporting. In the past, real time reporting required a lot more leg work. Perhaps an outside developer or someone who has worked with back end tools could sent your organization up, but now with tools like Power BI, Tableau, and Carto, real time geospatial reporting is expected.
💽 Where to start with dashboards?
Most dashboards consist of three main parts. Each of these parts can be handeled locally, or in the cloud. Additionally, each of these parts can be carried out manually or automated with software and applications.
- Data
- databases
- visualizations
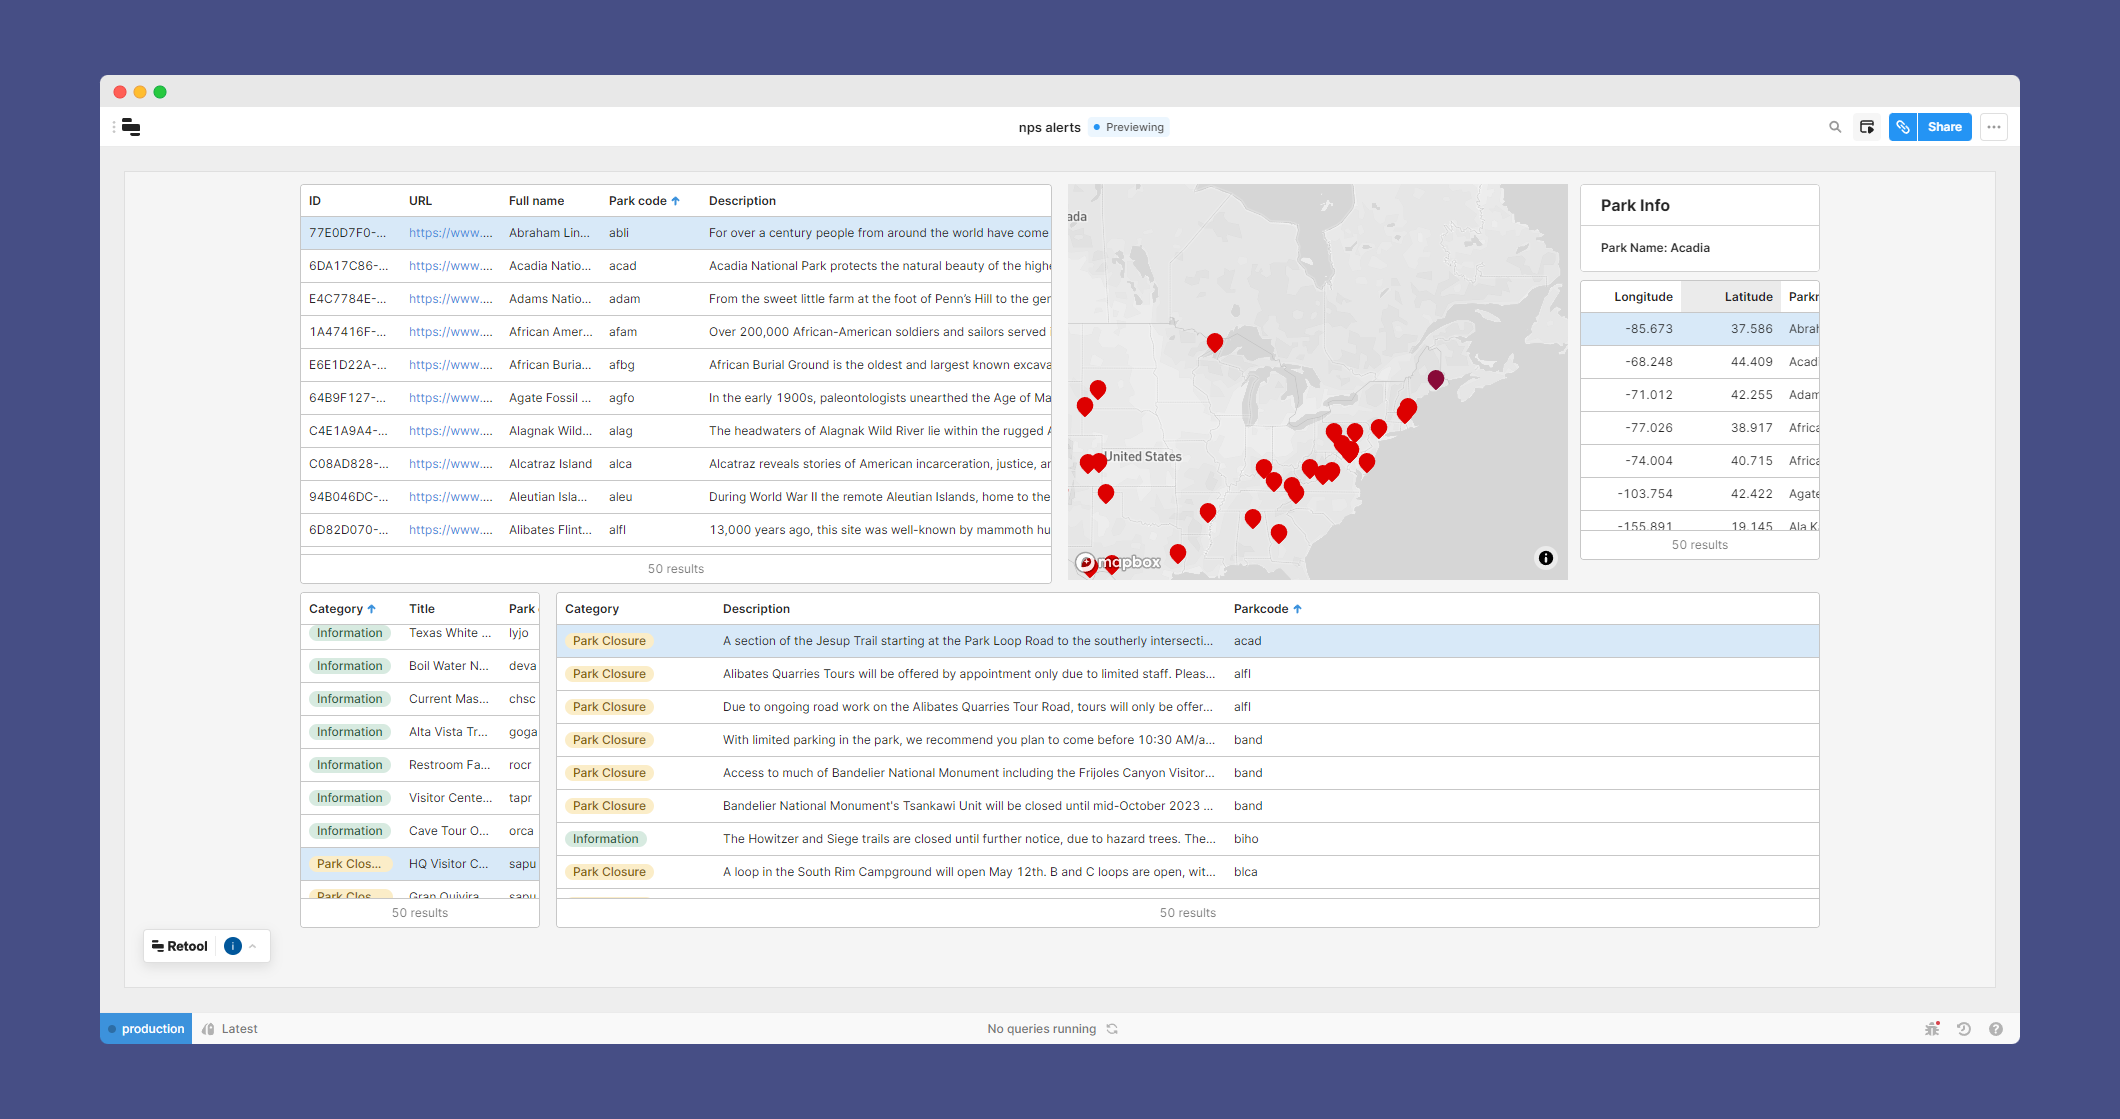
Like any geospatial project, data is going to be the foundation that your dashboard is built on. For a real time dashboard api's are going to be your best bet for live data feeds. One of my personal favorites to work with is the NPS (National Parks Service) API. This provides real time information on parks including names of parks and park codes, park designations, events, and alerts.

🗜 Tools to help
One of the best tools i've found to create dashboards with has been Retool.com. A web developer friendly drag and drop dashboard builder with plenty of pre-built tools and customization options. When it comes to geospatial options, retool.com is somewhat limited, currently, the only built in mapping feature is Mapbox and the options for the easy of drag and drop are limited.
 lukejamison
A much more robust option for mapping might be the Geomap panel visualization inside of Grafana. With the ability to host dashboards locally, Grafana is a heavy solution for dashboards that will require a lot of work on the front end.
📊 Why a dashboard?
A dashboard is the place where your data can live and breathe in real time. For Example, using the NPS api and Retool.com I was able to create this dashboard for National Park alerts. Now, each time I visit my dashboard, I can know where and what parks have alerts, and know what the information behind the alerts are, all in real time and shown on a map.
Giving users, and stakeholders real time information is powerful. As the cost for data continues to rise, providing value to users in the data an organization or client generates is key to bringing value to your organization.


