🎍Randomly Generated Map Prompts -ep 23

30 Day Map Challenge - 2022
Take a look at the work so far! A live blog of sorts where I will be adding the maps I create during the challenge. It's been fun exploring the data and creativity out there. The challenges are super fun and creative, even if you don't do every map, I would encourage you to try one or two that interest you.

glitch 🎏
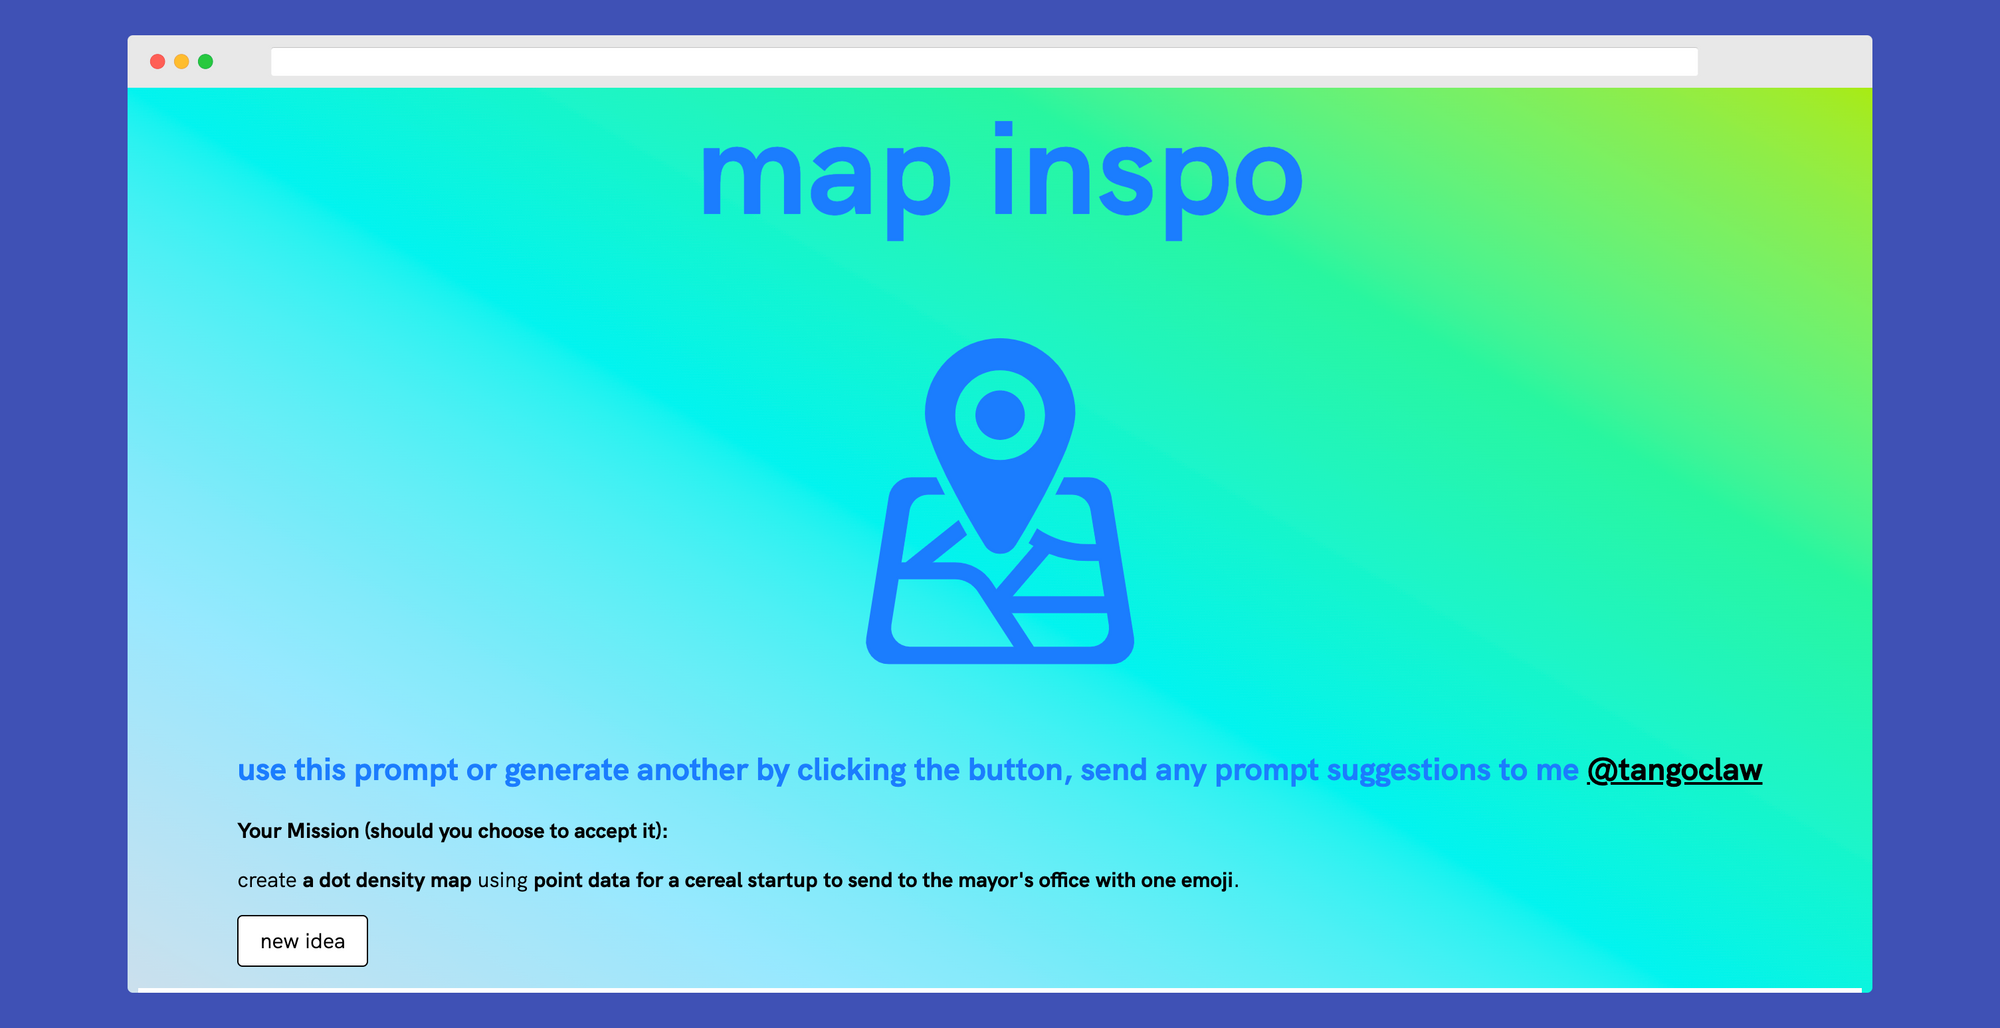
In keeping with our theme of 30 maps in 30 days, I created this simple map inspiration generator using glitch. If you want to exercise your creativity, give it a shot!
Try out the generator here:

Github 💾
A helpful R land surface temperature scrip for Calculating land surface temperature (LST) using Landsat 8 or 9 imagery. Very interesing and super helpful if you are using R in your geospatial projects.
 alyssakullberg
On the Bookshelf 📗
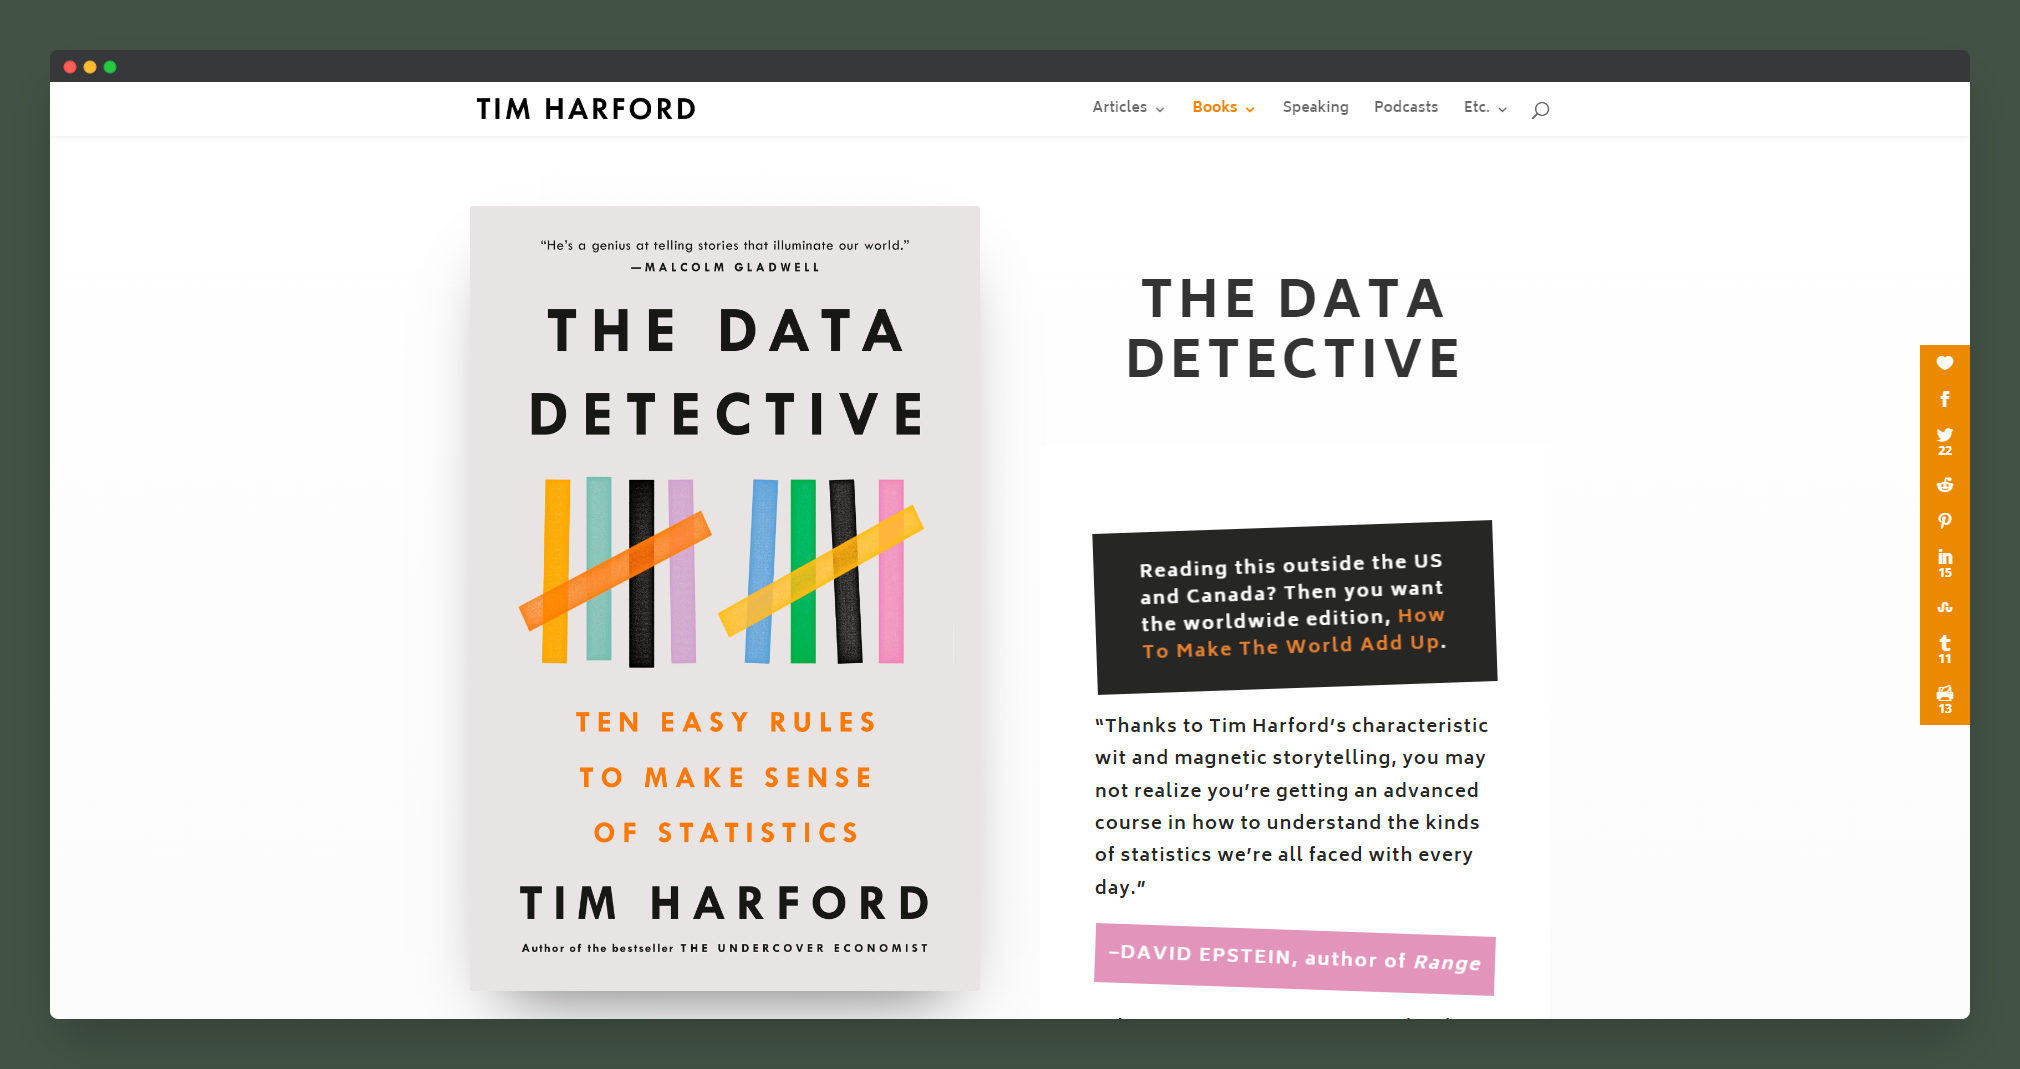
This week, I've really enjoyed getting into The Data Detective by Tim Harford. While making so many maps with so many different kinds of data, it's very easy to see how maps and data can be used to lie. This book has been a great introduction to the common mistakes in statistics and how to prevent data visualizations from moving away from the data in the pursuit of eye catching exhibits.