A Case for Desktop Network Analysis 🛣

Why would anyone need to know how to perform a desktop network analysis in a world where good browser based navigation api's exist?

If I simply want to understand the best path between to points, sure, a service like Google Maps is a great tool. However there are advantages and disadvantages to using an online mapping service for shortest path. Network analysis can extend beyond shortest path, but even in terms of shortest path, a desktop method has noted additional advantages.
So why a desktop network analysis? I wanted to see the advantages of a desktop shortest path location to help me better answer this question.
While I followed this tutorial for basics, several small changes had to be made for the Austin Texas road dataset I used to run a basic spatial analysis in the City of Austin. My goal was to find areas that a desktop shortest path analysis might fall short and might succeed over a simple Google Maps Search.
Austin Street Data
First, I downloaded street centerline data from Austin Open Data, the same data source I used for my other open data project.

The main difference being that data was brought in using an api call and this data will be downloaded directly. This dataset, like previously mentioned, can be brought in used online or downloaded as a shapefile like we are doing today.
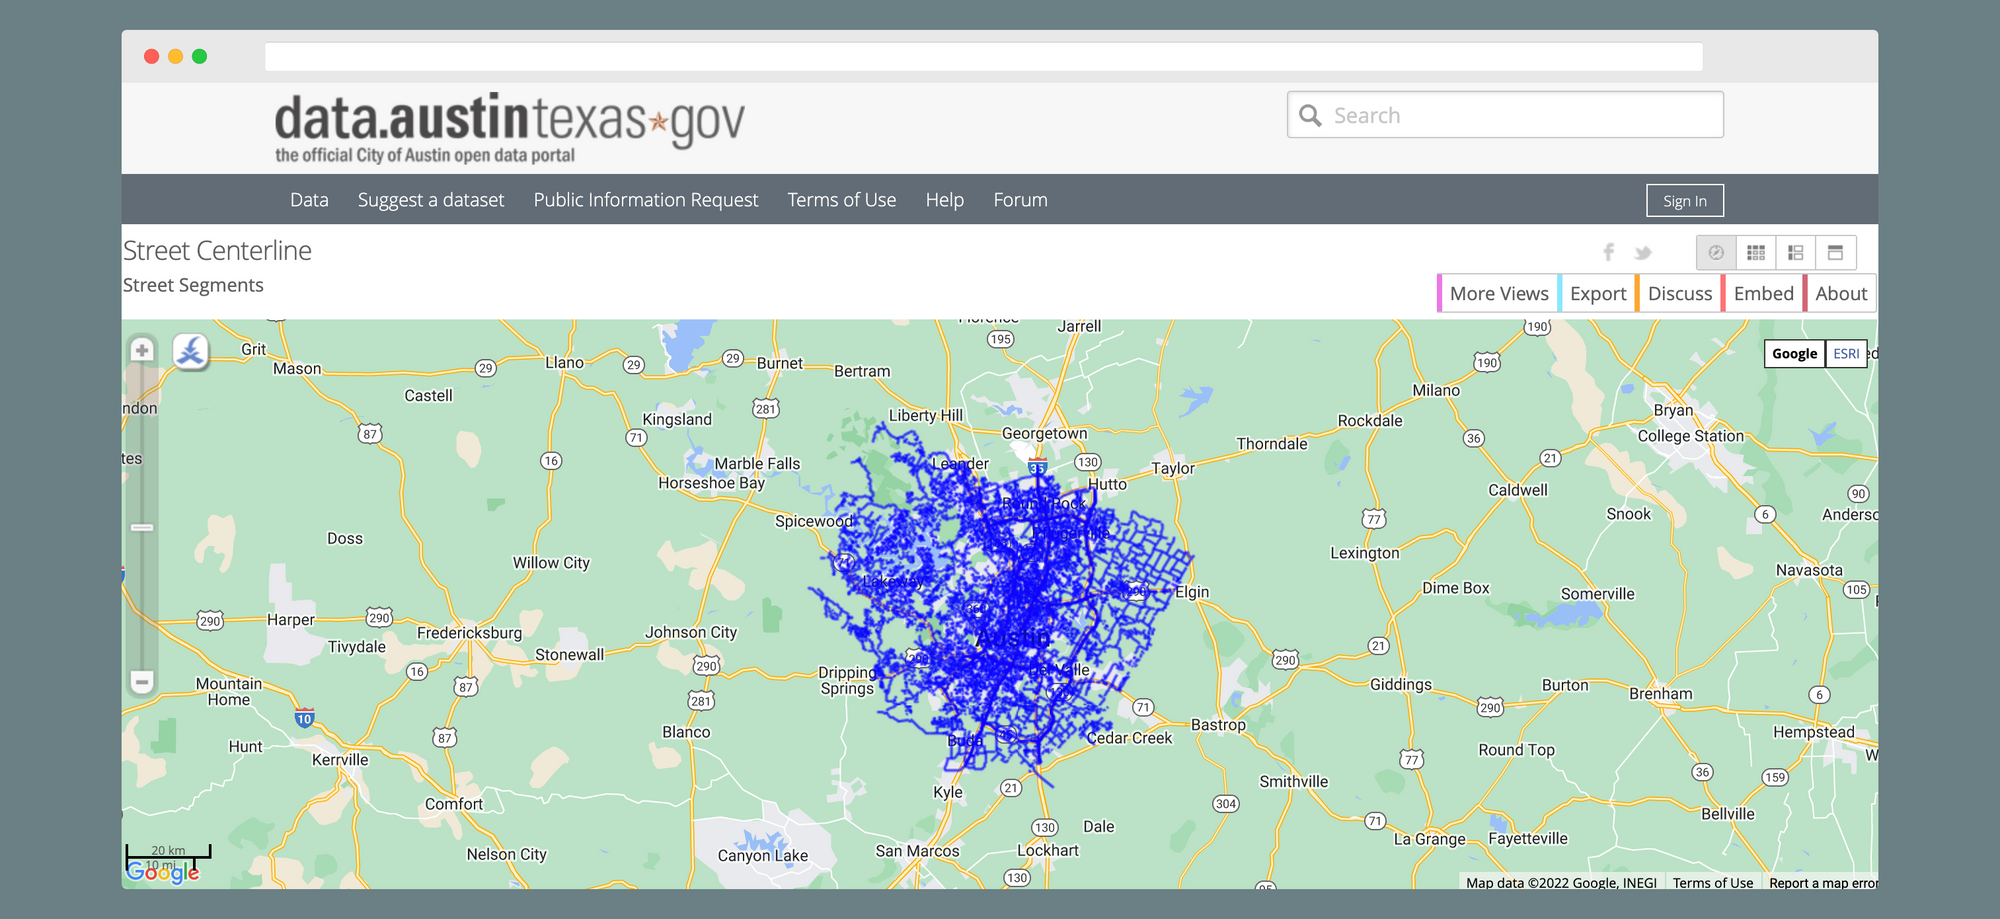
One of the biggest disadvantages of a desktop analysis is the fact that data is static. We can create databases that are active, but for this run, we are hard coding this data. A link to the full data can be found here:
Selecting for One Way Streets
This street centerline data thankfully contained a metadata file so we can understand what the fields mean. The field we are looking for is the field that lets us know how one way streets are designated in the dataset. A view of the data gives us ONE_WAY, which is has this written in the metadata:
The complete metadata file can be found here, but in short summary, you can learn about what value is contained in each field and what the field data definitions are. This is where we move away from the tutorial a little bit. An advantage of desktop analysis is the ability to understand the parts that give us our final result. Even a service like Mapbox Direction API is somewhat of a black box. A location goes in, and a path comes out. We don't often get to see what made this happen.
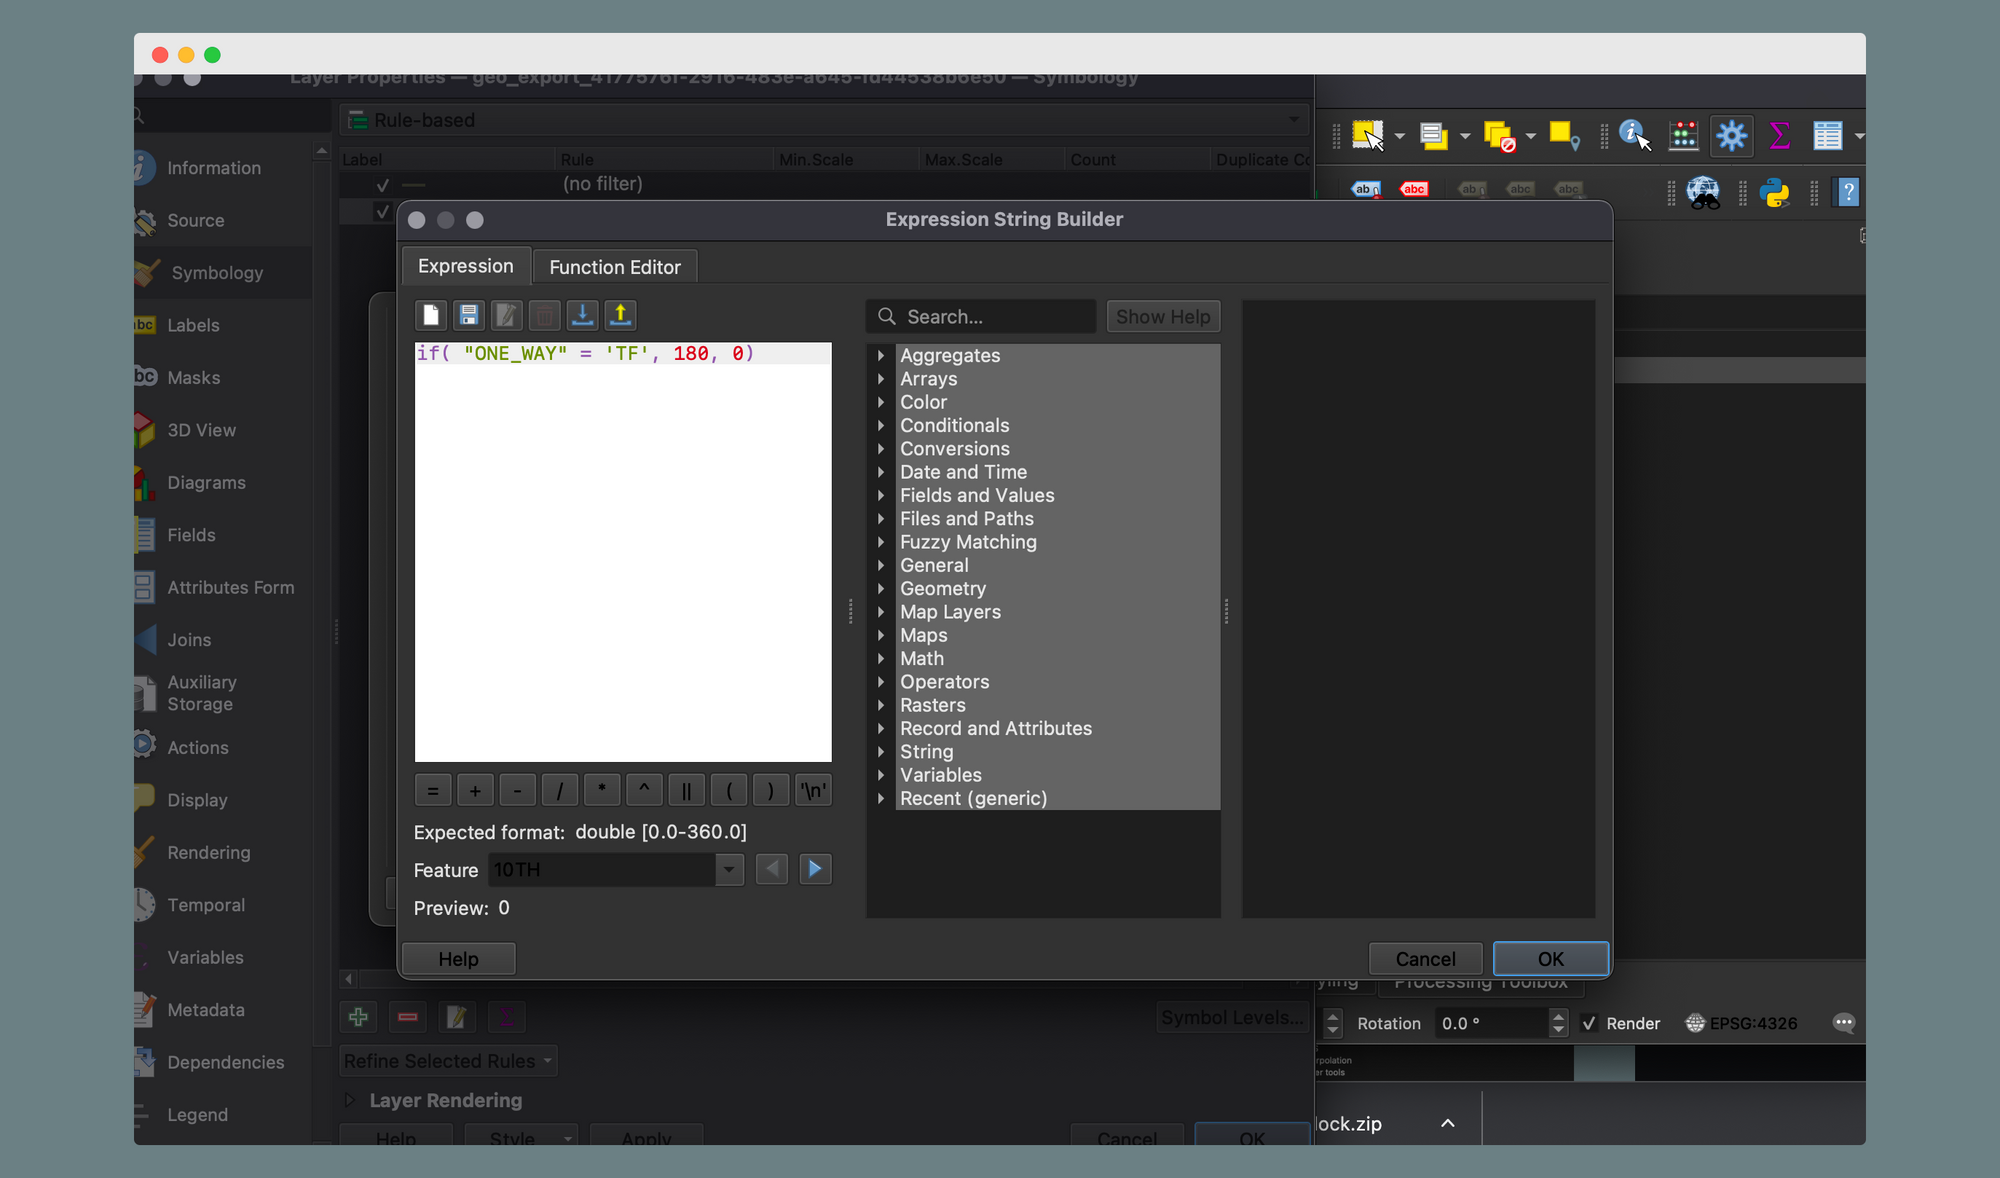
In the Washington D.C. dataset found in the tutorial, different names were used for one day streets and their directions. We will have to adjust formulas
Instead of SUMMARYDIR Austin uses ONE_WAY.
Instead of IB and OB for direction fields, Austin uses FT and TF.
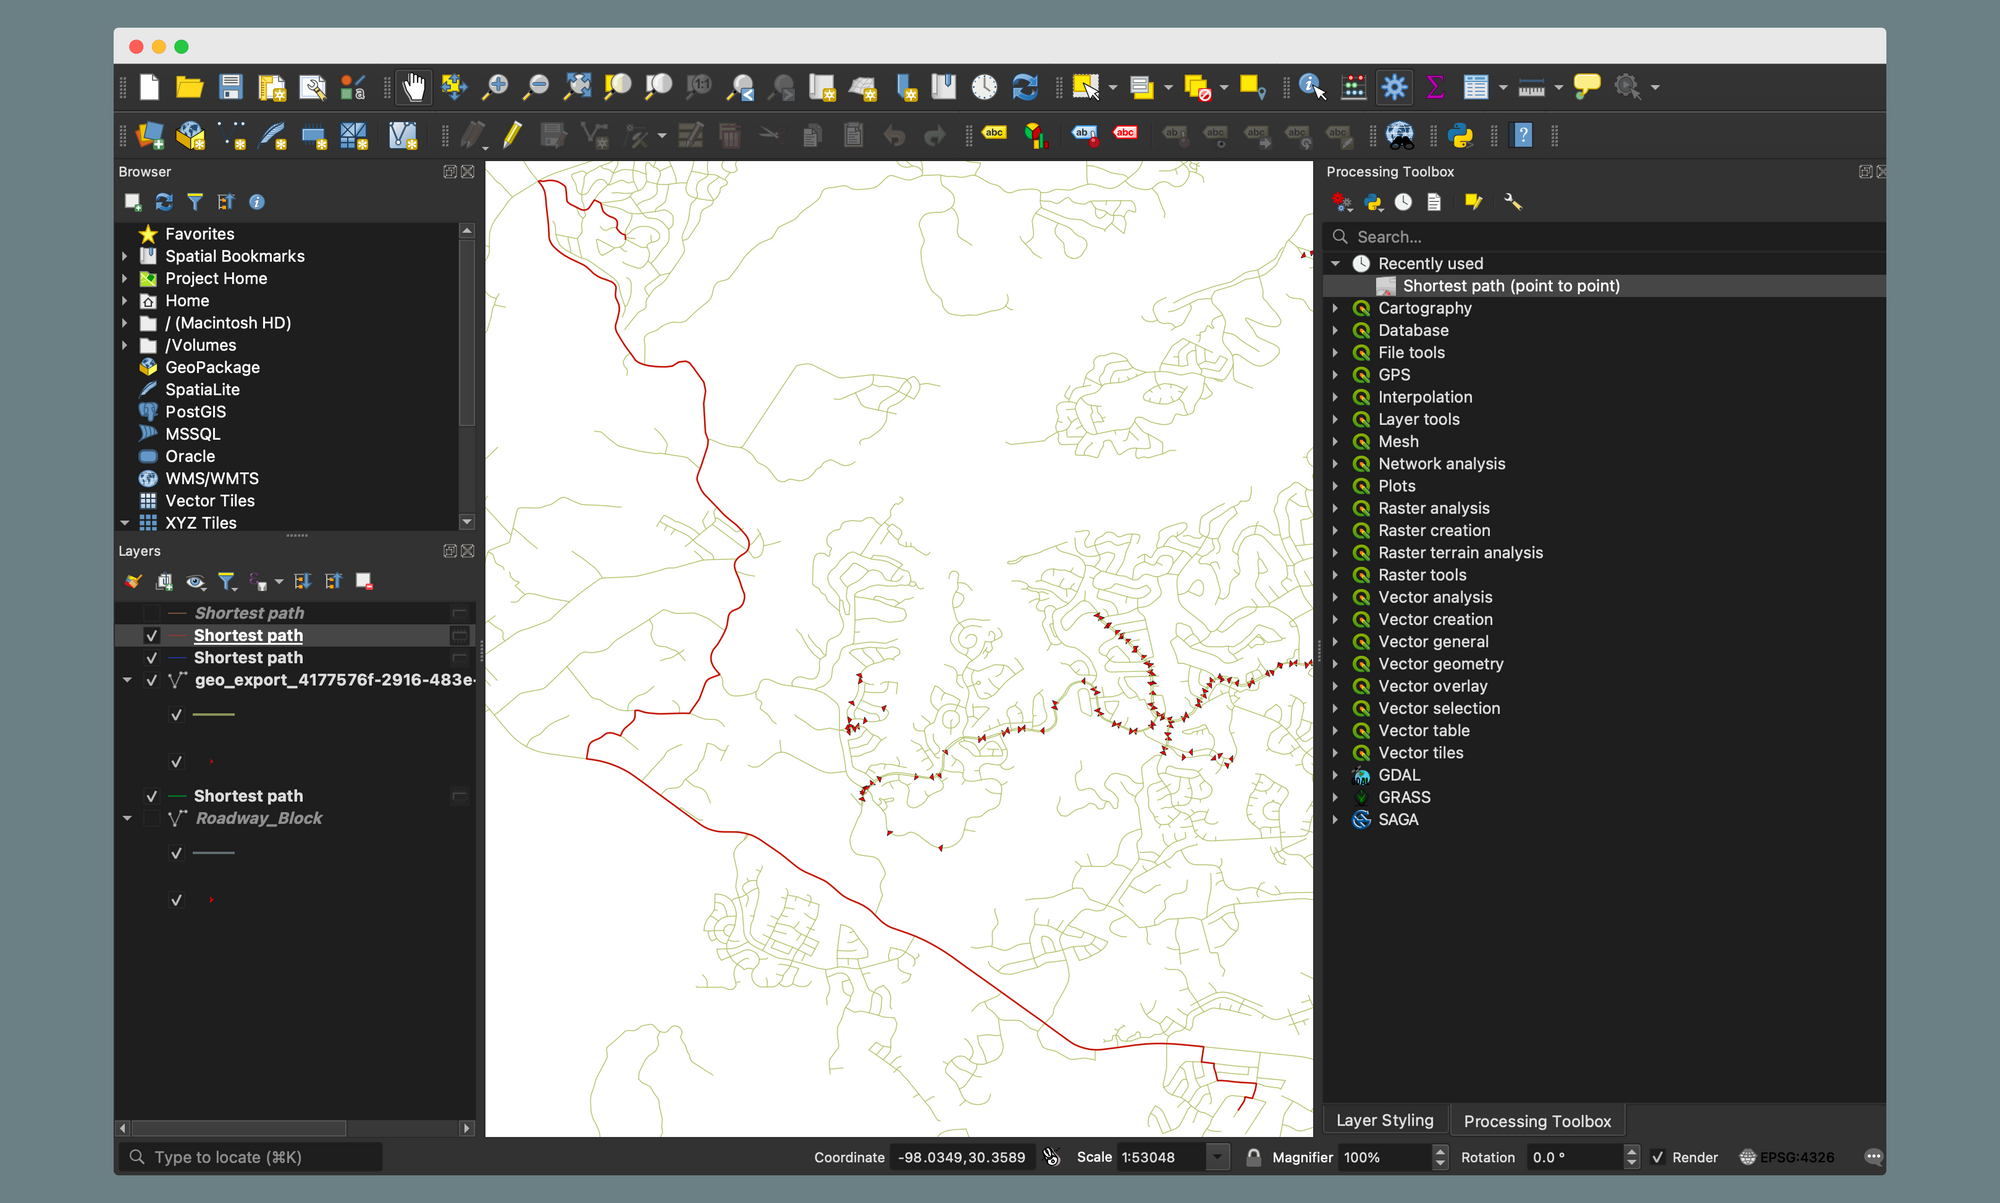
Aside from these minor changes, following the aforementioned tutorial gets the same result. A simple shortest distance network polyline that accounts for one way streets.
Why Should we use Desktop network analysis if Google Maps Exists?
This is a question that continued to come to mind as I was working though this tutorial. If a service like Google Maps exists, why would I ever need to run a desktop network analysis in QGIS.
The obvious answer is that a navigation map and an analysis do two different things. However, knowing when to use tools is just as important as what they do.
That being said, for a A to B nearest navigation Google Maps has us beat. But for advanced spatial analysis, there are several reasons why you might want to perform a desktop network analysis. Even with tools like Mapbox that can visualize networks and perform analysis, is there still a reason to keep a desktop analysis method in your mind?
- Road data doesn't exist yet. - You want to understand how a future road will affect traffic, how a new trail will fit between a park, or the nearest store to a point of interest. If you are interested in data that doesn't exist you'll need to formulate your own.
- Advanced traffic analysis: If you are working on a civil engineering project for example, you may want to understand traffic flow of a new subdivision. This is not strictly a navigation problem, but you could use your roadway linework to understand potential choke points that many users will encounter with standard online mapping applications.
- Complex rule based analysis. Often times, shortest distance isn't exactly what determines how a network functions. Other factors such as time, accessibly, simplicity, and areas of interest can be part of the question being understood. Applying more rules and factors can lead to better maps and more answers to network questions
- Advanced visualizations for web applications. Network visualizations can be complex to visualize. Even with a service like Mapbox that can display a basemap layer with custom rules and visualizations, you may want to create new fields to display in your web map or give more options for users. An editable shapefile on a desktop application like QGIS is perfect for modifying a basemap.
- Applications beyond the answer. After you complete a desktop analysis you can keep your result. Then, future research can be done with it. Maintaining data is one of the best ways to learn more and make the data work for you.
Conclusion
Network analysis is one of the best application of modern geospatial technology. If you are looking for a free way to perform a network analysis for use in research or creating basemap layers for applications, you can perform a variety of network visualizations within QGIS that win over a browser based analysis.


