Case Study: Mapbox Heatmaps and Tacos 🧨

Creating elegant heatmaps that scale can be a challenge. I remember the days creating them in ArcMap back in the day. Lot's of trial and error. But even with the most attention to detail, they were, at the end of the day, static.
A Tale of Tacos 🌮
Earlier this week on discords, we were having a talk about a gas station food. Being from Texas of course the name Laredo Taco Company came up.
If you aren't familiar, Laredo Taco Company or LTC is a chain of restaurants located inside Valero and 7-11 Gas stations with a few semi stand alone locations as well. When one of our Texan discord members mentioned not ever hearing about this chain that most of the others had heard of, it made me think about the distribution of this chain.
So I got to work.
Homemade Data 💾
So one of the more challenging parts of this project was finding the data. A web scraper was my first thought. However a closer look at the homepage revealed a webpage with the all the locations. Let's not overcomplicate things.
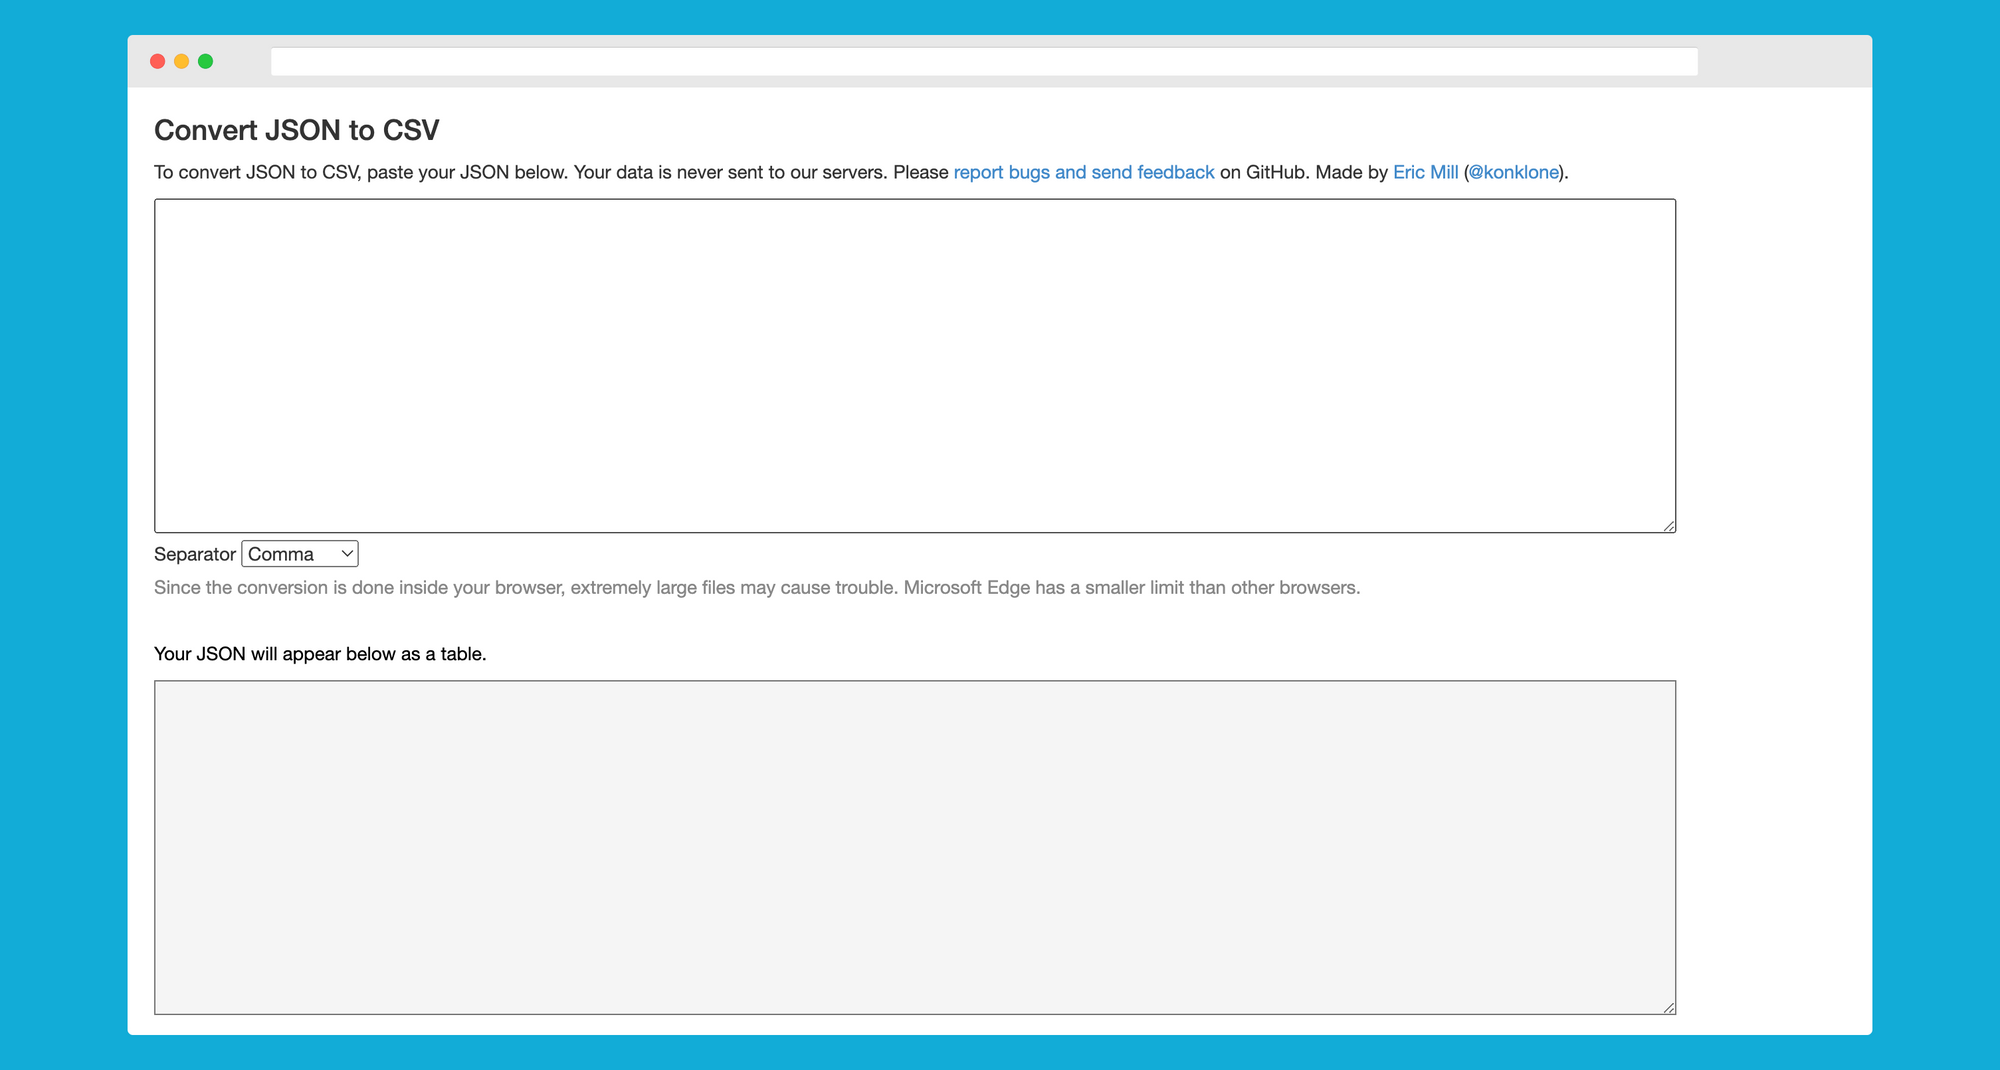
Once I had the raw data, I set to editing it to make sure it was formatting properly. I converted the json to a csv using an online converter.
Now in csv form, further editing was done, removing some redundant and unneeded fields. I simply did this in Google Sheets.
Then with the final result, I loaded the csv into Qgis using this method.
One overall location shapefile 📒
Fix the ones that could not be geocoded. Most were a quick fix. Just a few google searches and a few edits to lat and lon values that didn't quite make it over. All in all this wasn't the worst fix, considering I was working with Open Street Map's Nominatim service instead of Google Maps.
Then using the "Merge" tool in Qgis to combine the geocoding results and the fixed-by-hand files we now have one shapefile of all LTC locations across the US.
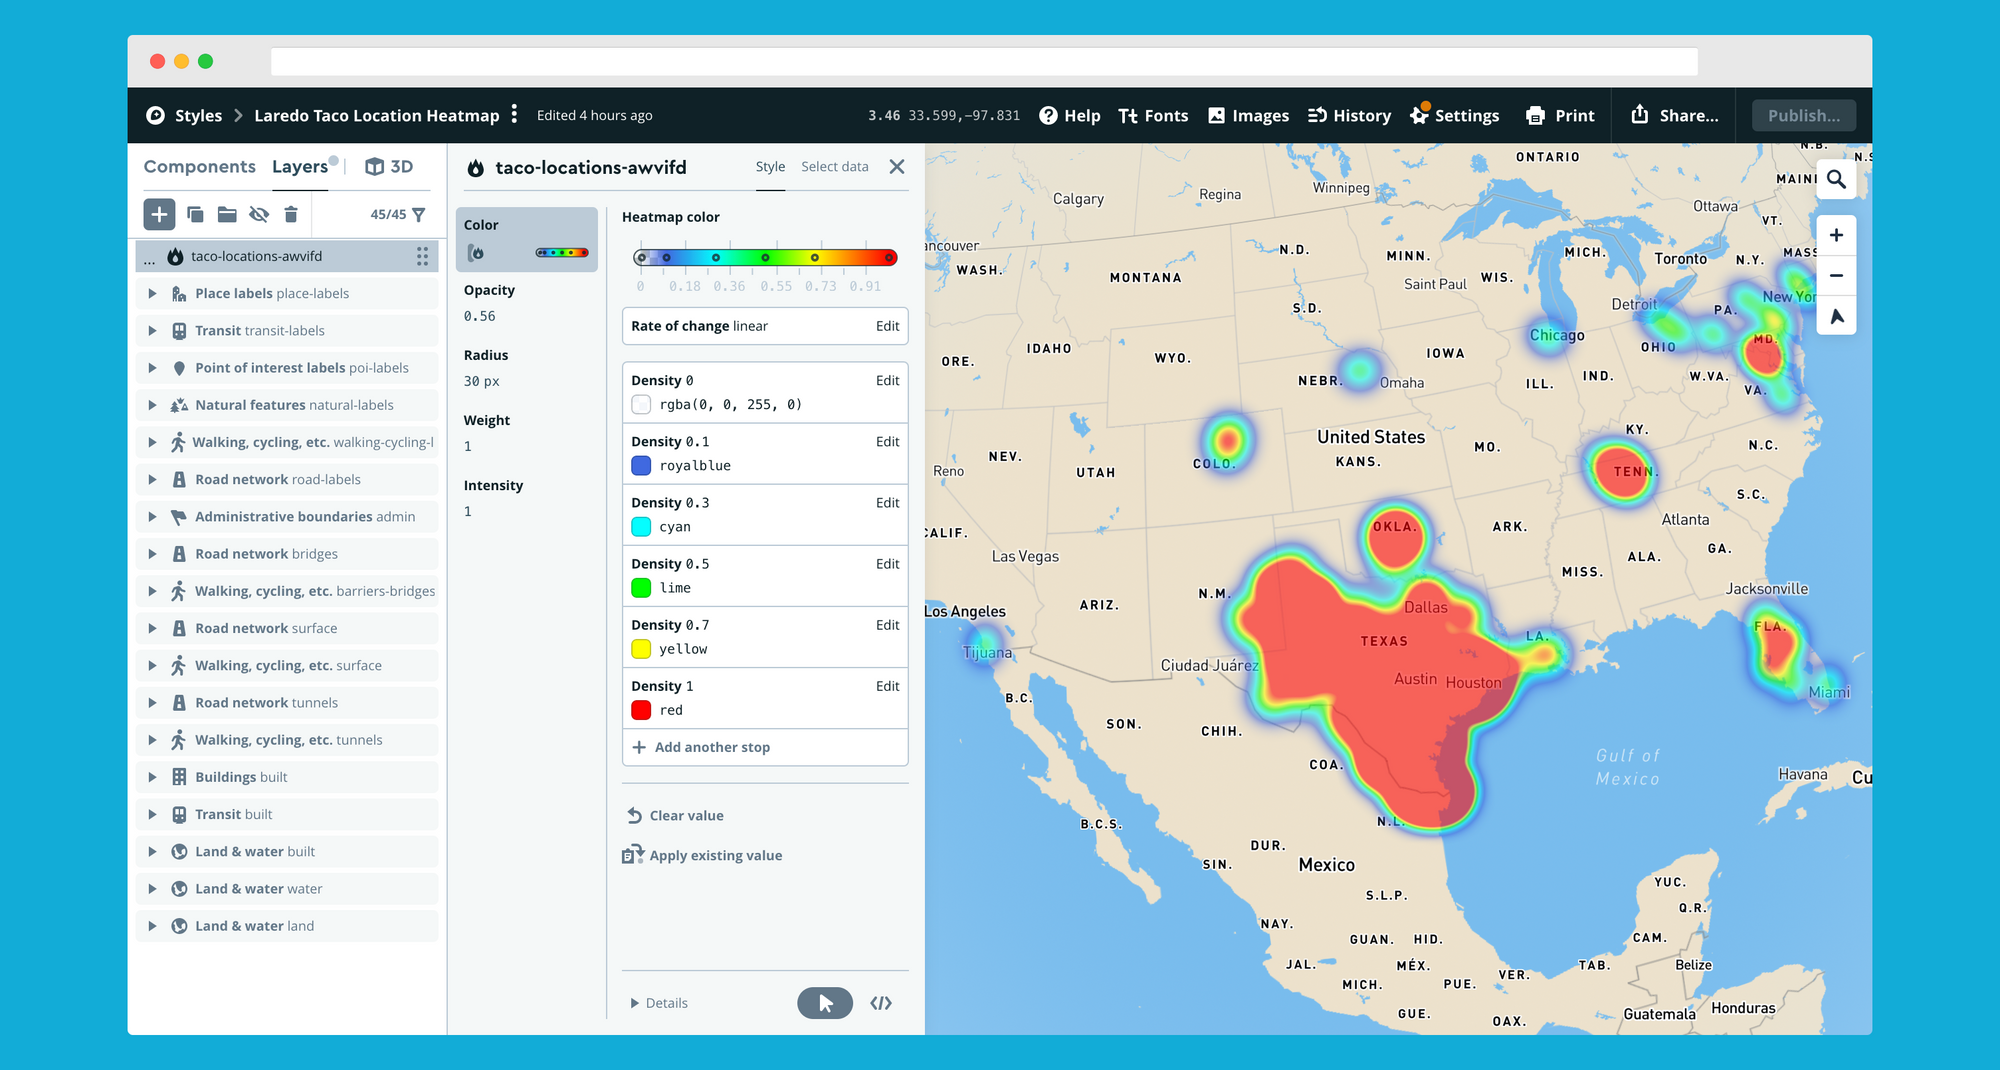
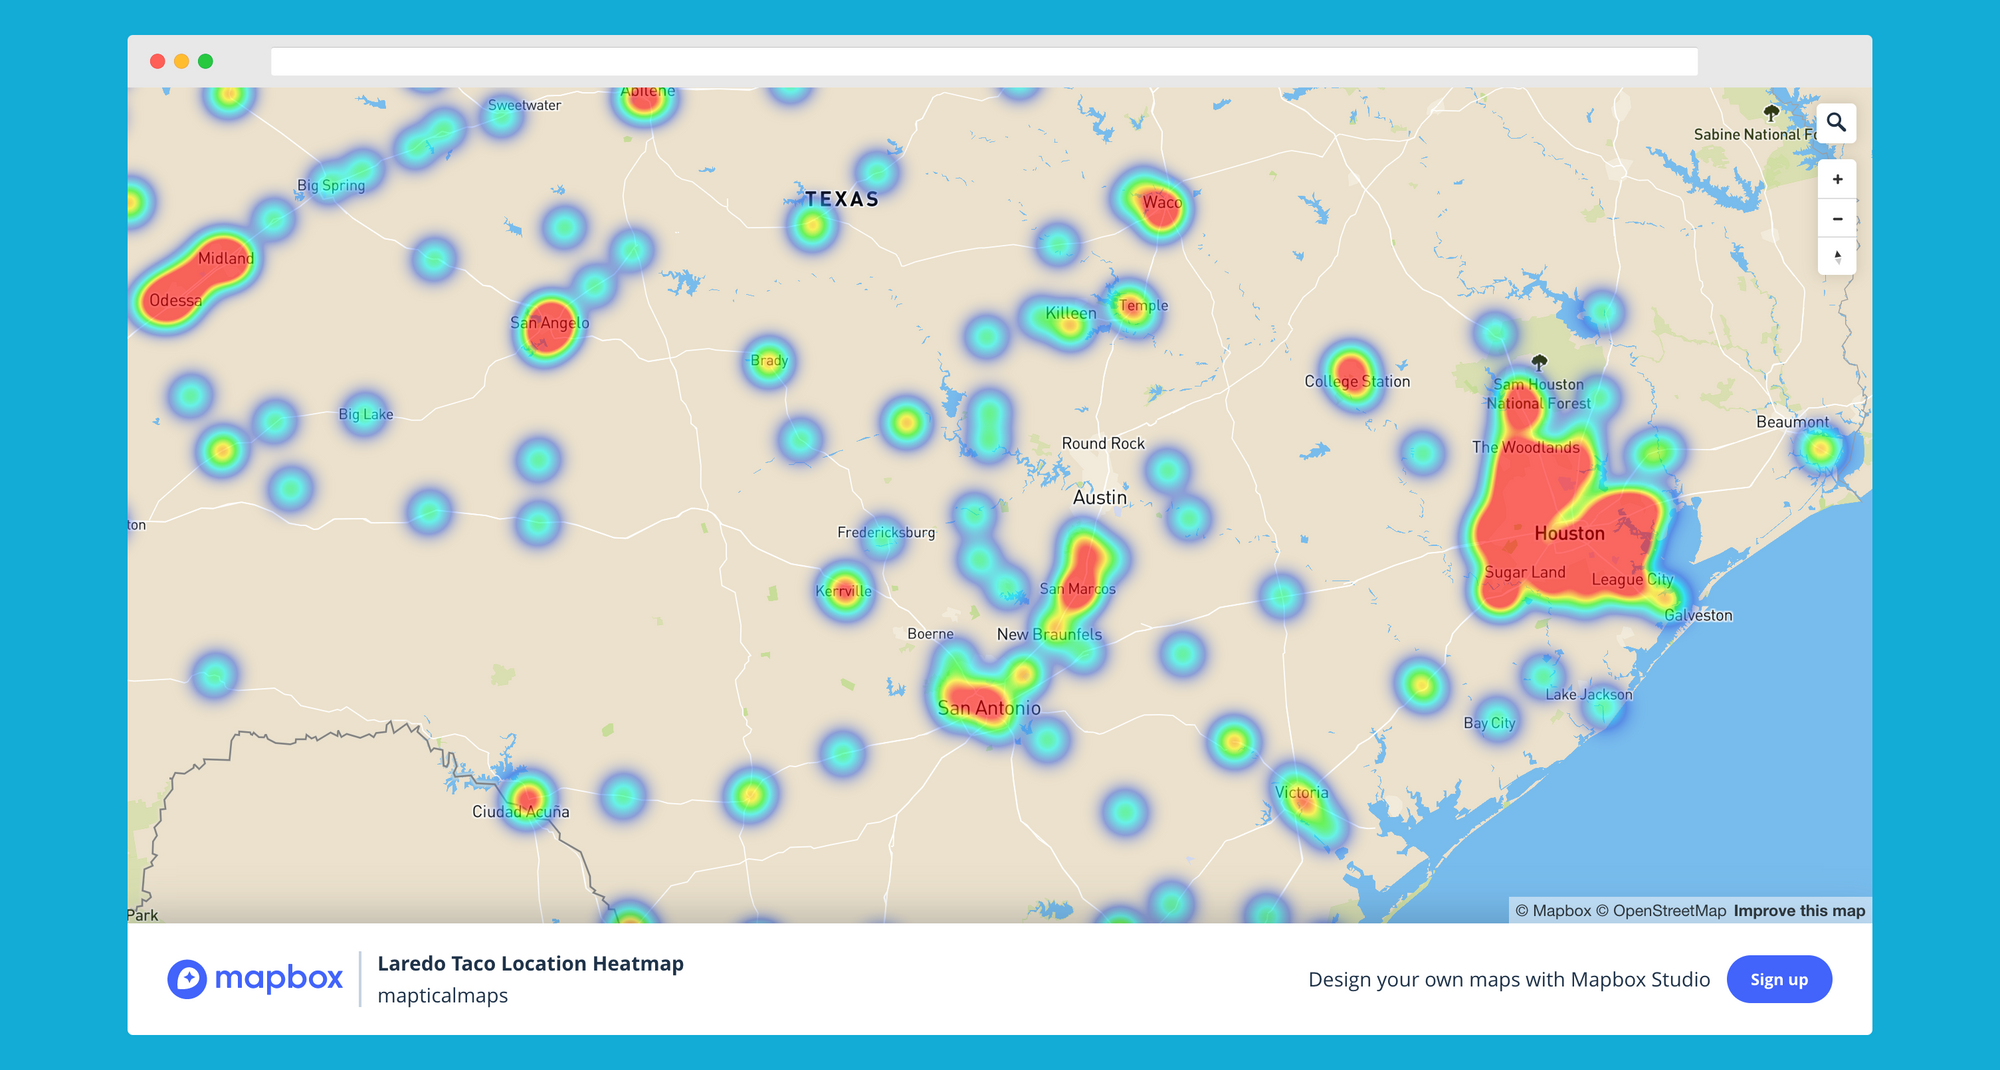
Things are Heating Up 🔥
The simplest way to create an interactive heatmap I found is to use the Mapbox Create a heatmap layer tutorial. With a Mapbox account, you can quickly upload your data, and with simple and easy layer tools, the Laredo Taco Company Location Heatmap is ready to view! Take a look at the live demo below:


