💵 how valuable is your data?

As we approach the middle of the year, I can't help but reflect on the year so far. If you are like me you like to set goals and you want to see them completed in a few weeks.
I've had to come to the realizations that most worthwhile goals take time. I've also learned that I need small victories along the way.
Have you fallen off track? Give yourself a small victory that sets you on the right path again. Making progress? Reflect on the past victories and successes to plan for the future.
productivity 🗒
One of the most incredible finds this week has been lofiatc. Atc stands for Air Traffic Control and this web application plays lofi over whatever atc radio you select. Working and focusing with this application is quickly becoming part of my productivity flow.

That being said, I am seeing a growing trend of "focus environment" apps. I am working on a list and blog post of a few of my favorites. Stay tuned!
further reading 🎓
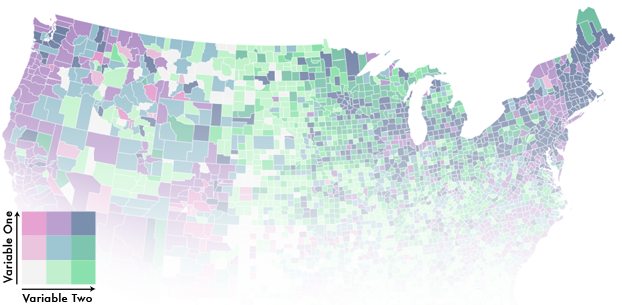
Bivariate Choropleth Maps are one of the most interesting and creative maps I've seen in a long time. I was reminded of them this week when I saw a question on twitter asking for creative ways to show relations between several factors.
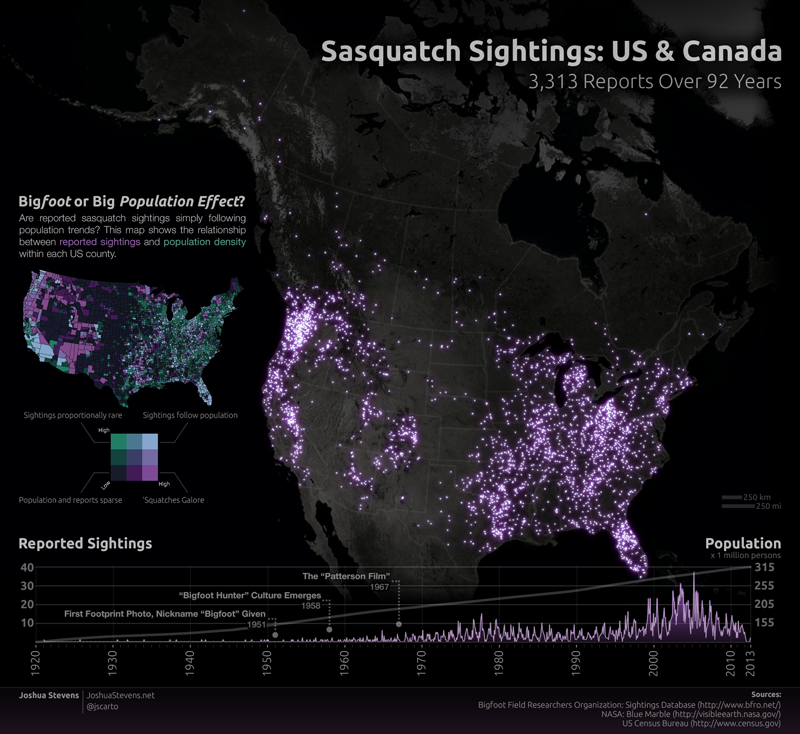
If you want to learn to create your own visualizations like this, Joshua Stevens has a phenomenal write up and how to guide which you should check out.
dev 💾
How much is your data worth? How much is your company data worth sitting in a sever? Real time data is growing in value each day. We live in a more and more connected world. So how can we make our visualizations and data more valuable to our organizations? Access - with the aid of GIS Dashboards.

on the playlist🔮
One of the most melodic, groovy albums I've heard in a while with plenty of "riffage" (their word not mine), and enough sax to give you those sweet retrowave nostalgia waves, Goblin Hours has been on repeat.