REM Visualization With Python

What is an REM?
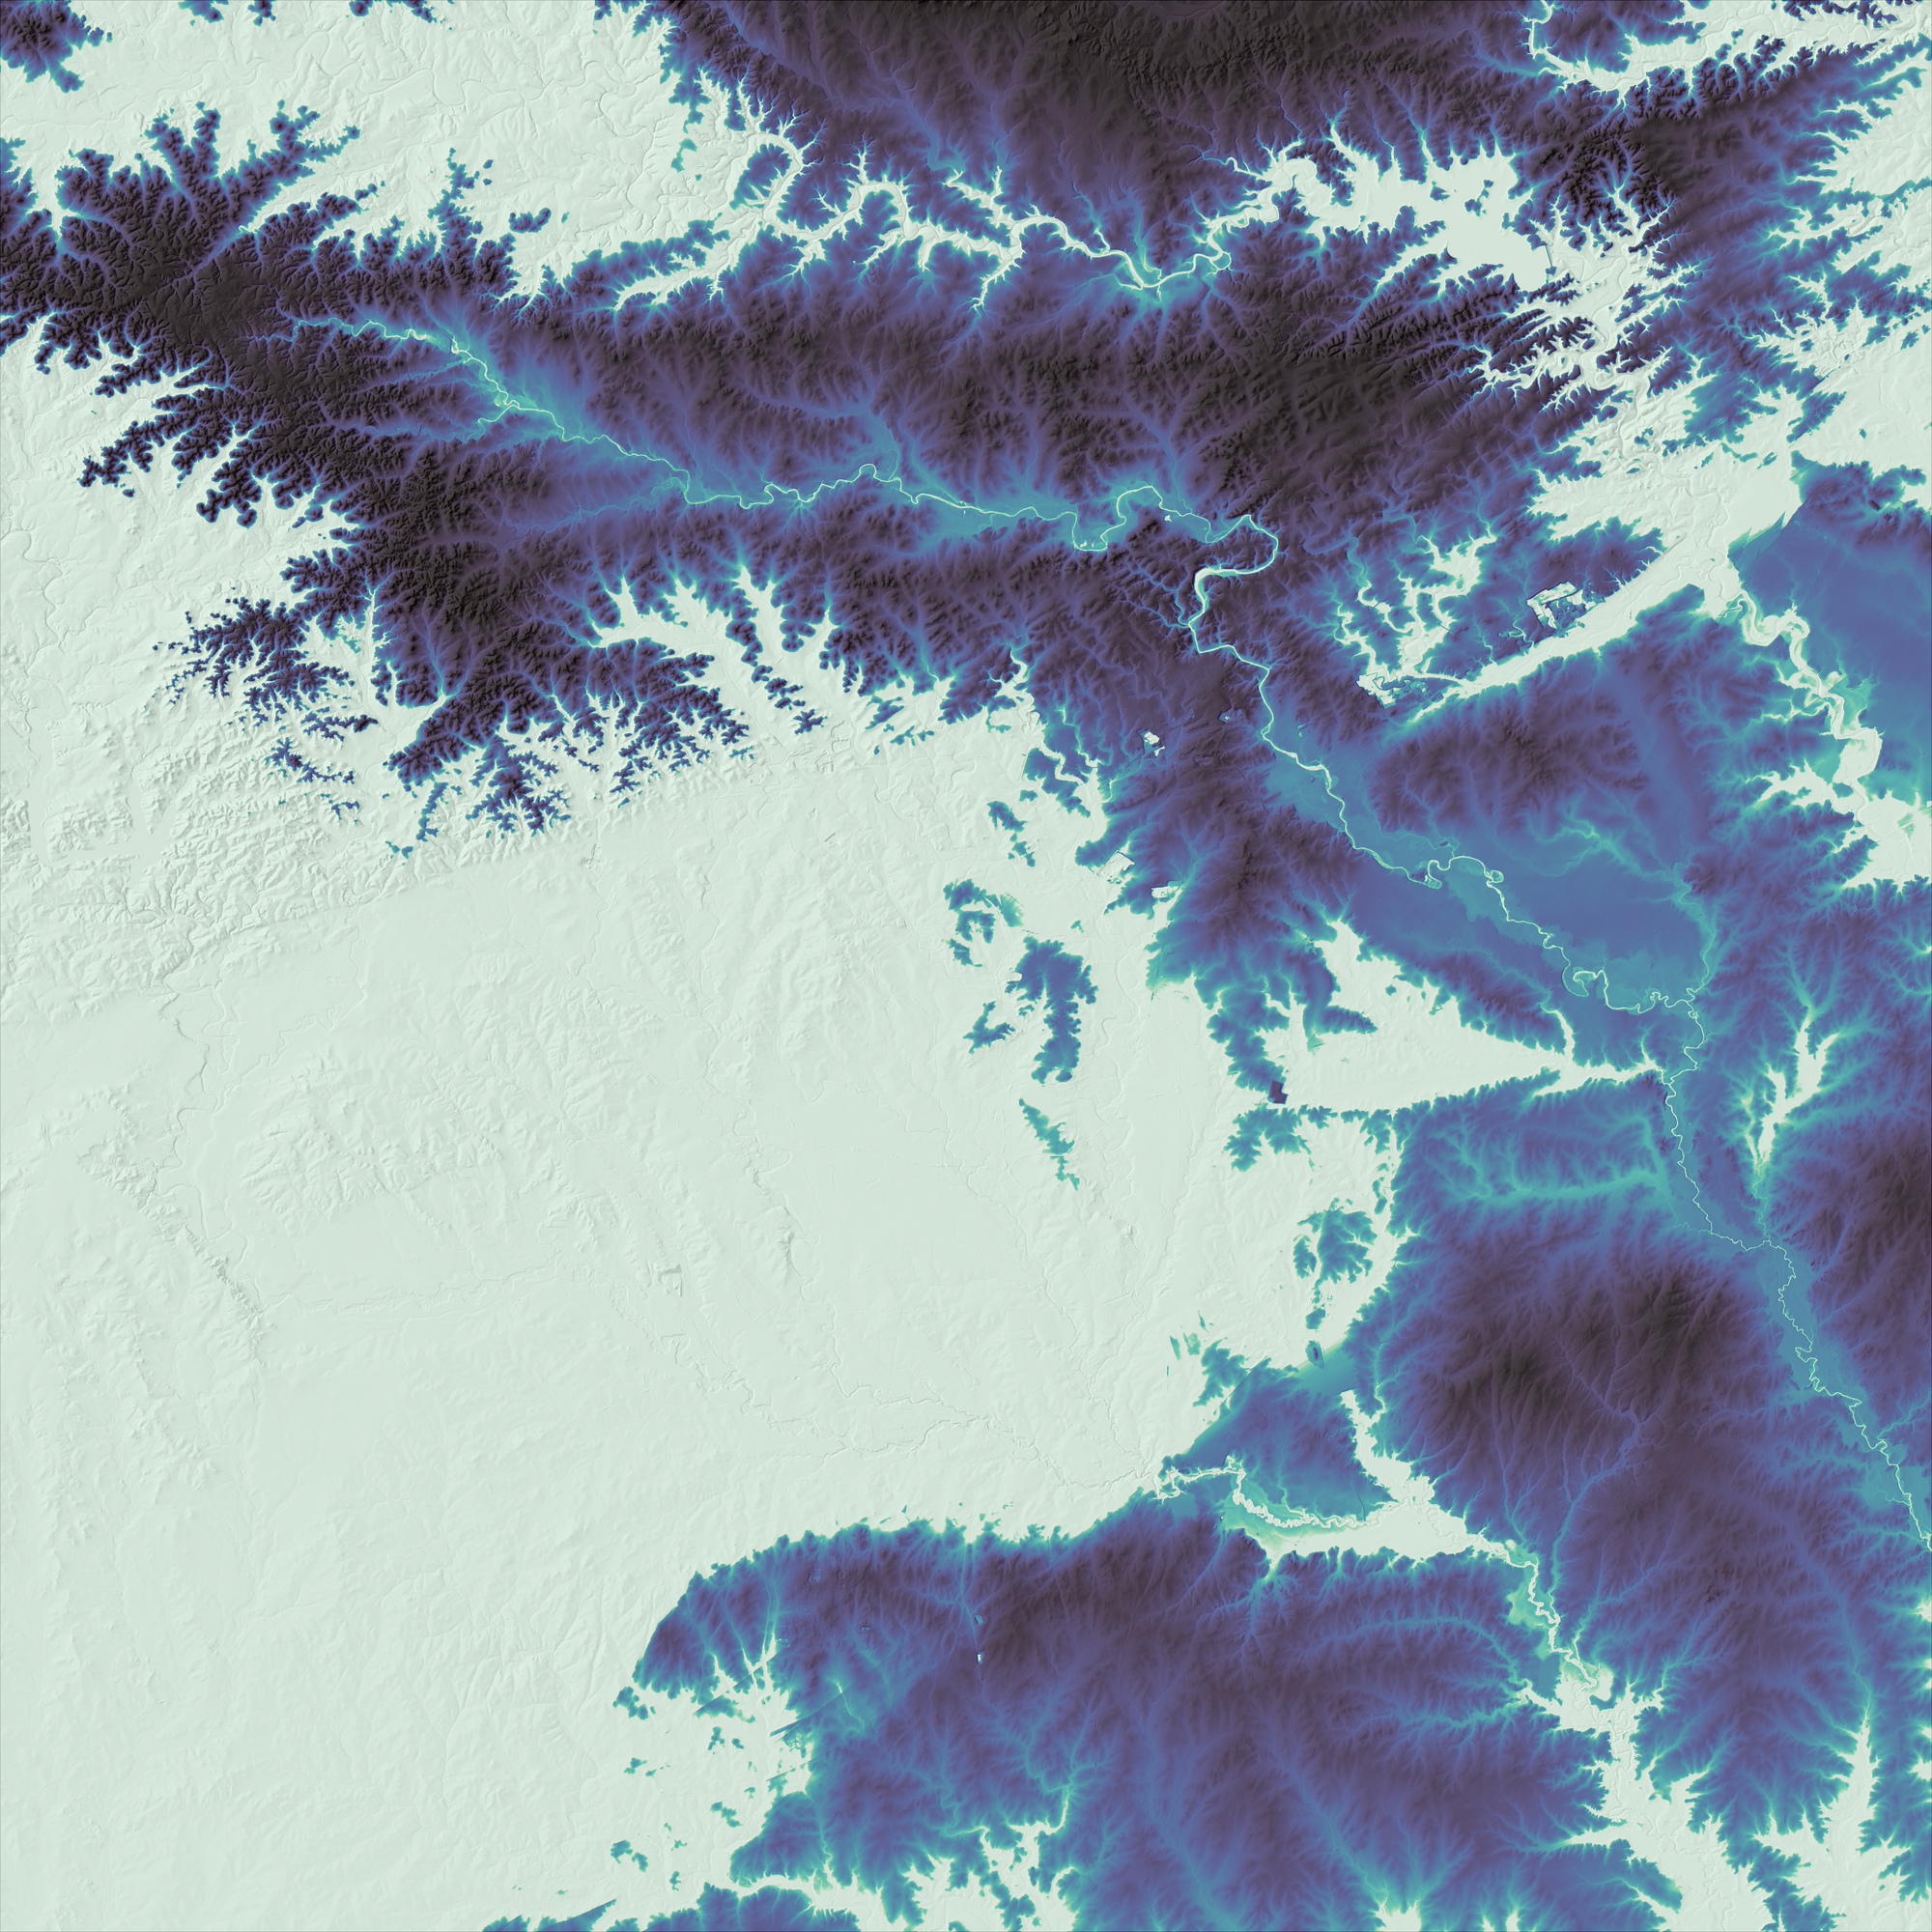
REMs, also known as Relative Elevation Models, are derived from DEMs. The purpose is to use river elevation to normalize elevation data to reveal trends that are not easily visible using standard DEM visualization.
I'll admit this concept gave me trouble at first. It wasn't until I saw the visualizations that the practical nature of REMs was more apparent.
This extensive article by Daniel Coe was extremely helpful in getting into the meat and bones of REMs including how they can be created using QGIS.
But therein was found the issue. Creating an REM within a standard desktop application is very challenging. The fact is even with these two methods, the steps used can be very intensive.
We start with ether cross sections or stream centerline. These two methods can be time consuming. The cross section method, using QGIS used by Coe is very good, but I was even finding myself at times wondering if there was a way to script or automate some of these processes.
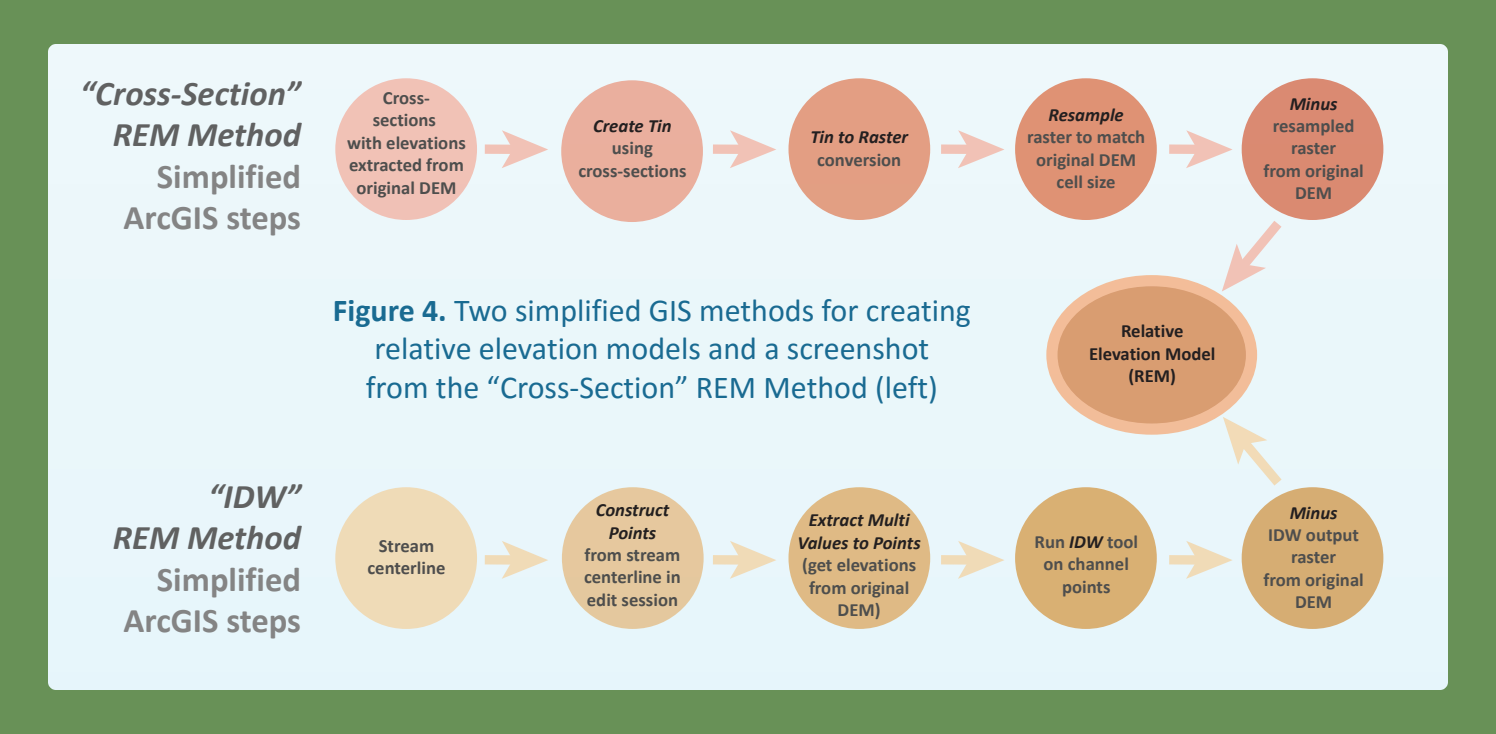
Even with scripting, it's a bit of an art to measure, construct, and re-generate to find the best visualization within QGIS or ArcMap. It is in part to the sheer amount of data we are dealing with.
OpenTopology and RiverREM
Fortunately OpenTopology and more specifically Kenneth Larrieu have developed a method to create REMs using just a few lines of python. If you are interested in a more detailed description of the methods used, feel free to read this article on the OpenTopology blog. In short, it extracts elevation data from OpenStreetMap and runs calculations over the selected DEM.
Using Anaconda
Now for many good reasons, this script has been packaged and is available via Anaconda. If you are not familiar with this service you can read my full post on it here. But in short, Anaconda provides data and data science python users a way to quickly download and work with packages, moving and saving them with each environment as need be.

Once you've installed Anaconda and have configured your system, you can then begin installing the needed package that contains the python to REM code. If you are unfamiliar with Anaconda this can be time consuming and my advice is to basically make sure everything you install is fresh and updated. Second, make sure that any install is done with admin or system wide access. There's a lot of crossed wires and it only takes one to mess things up.
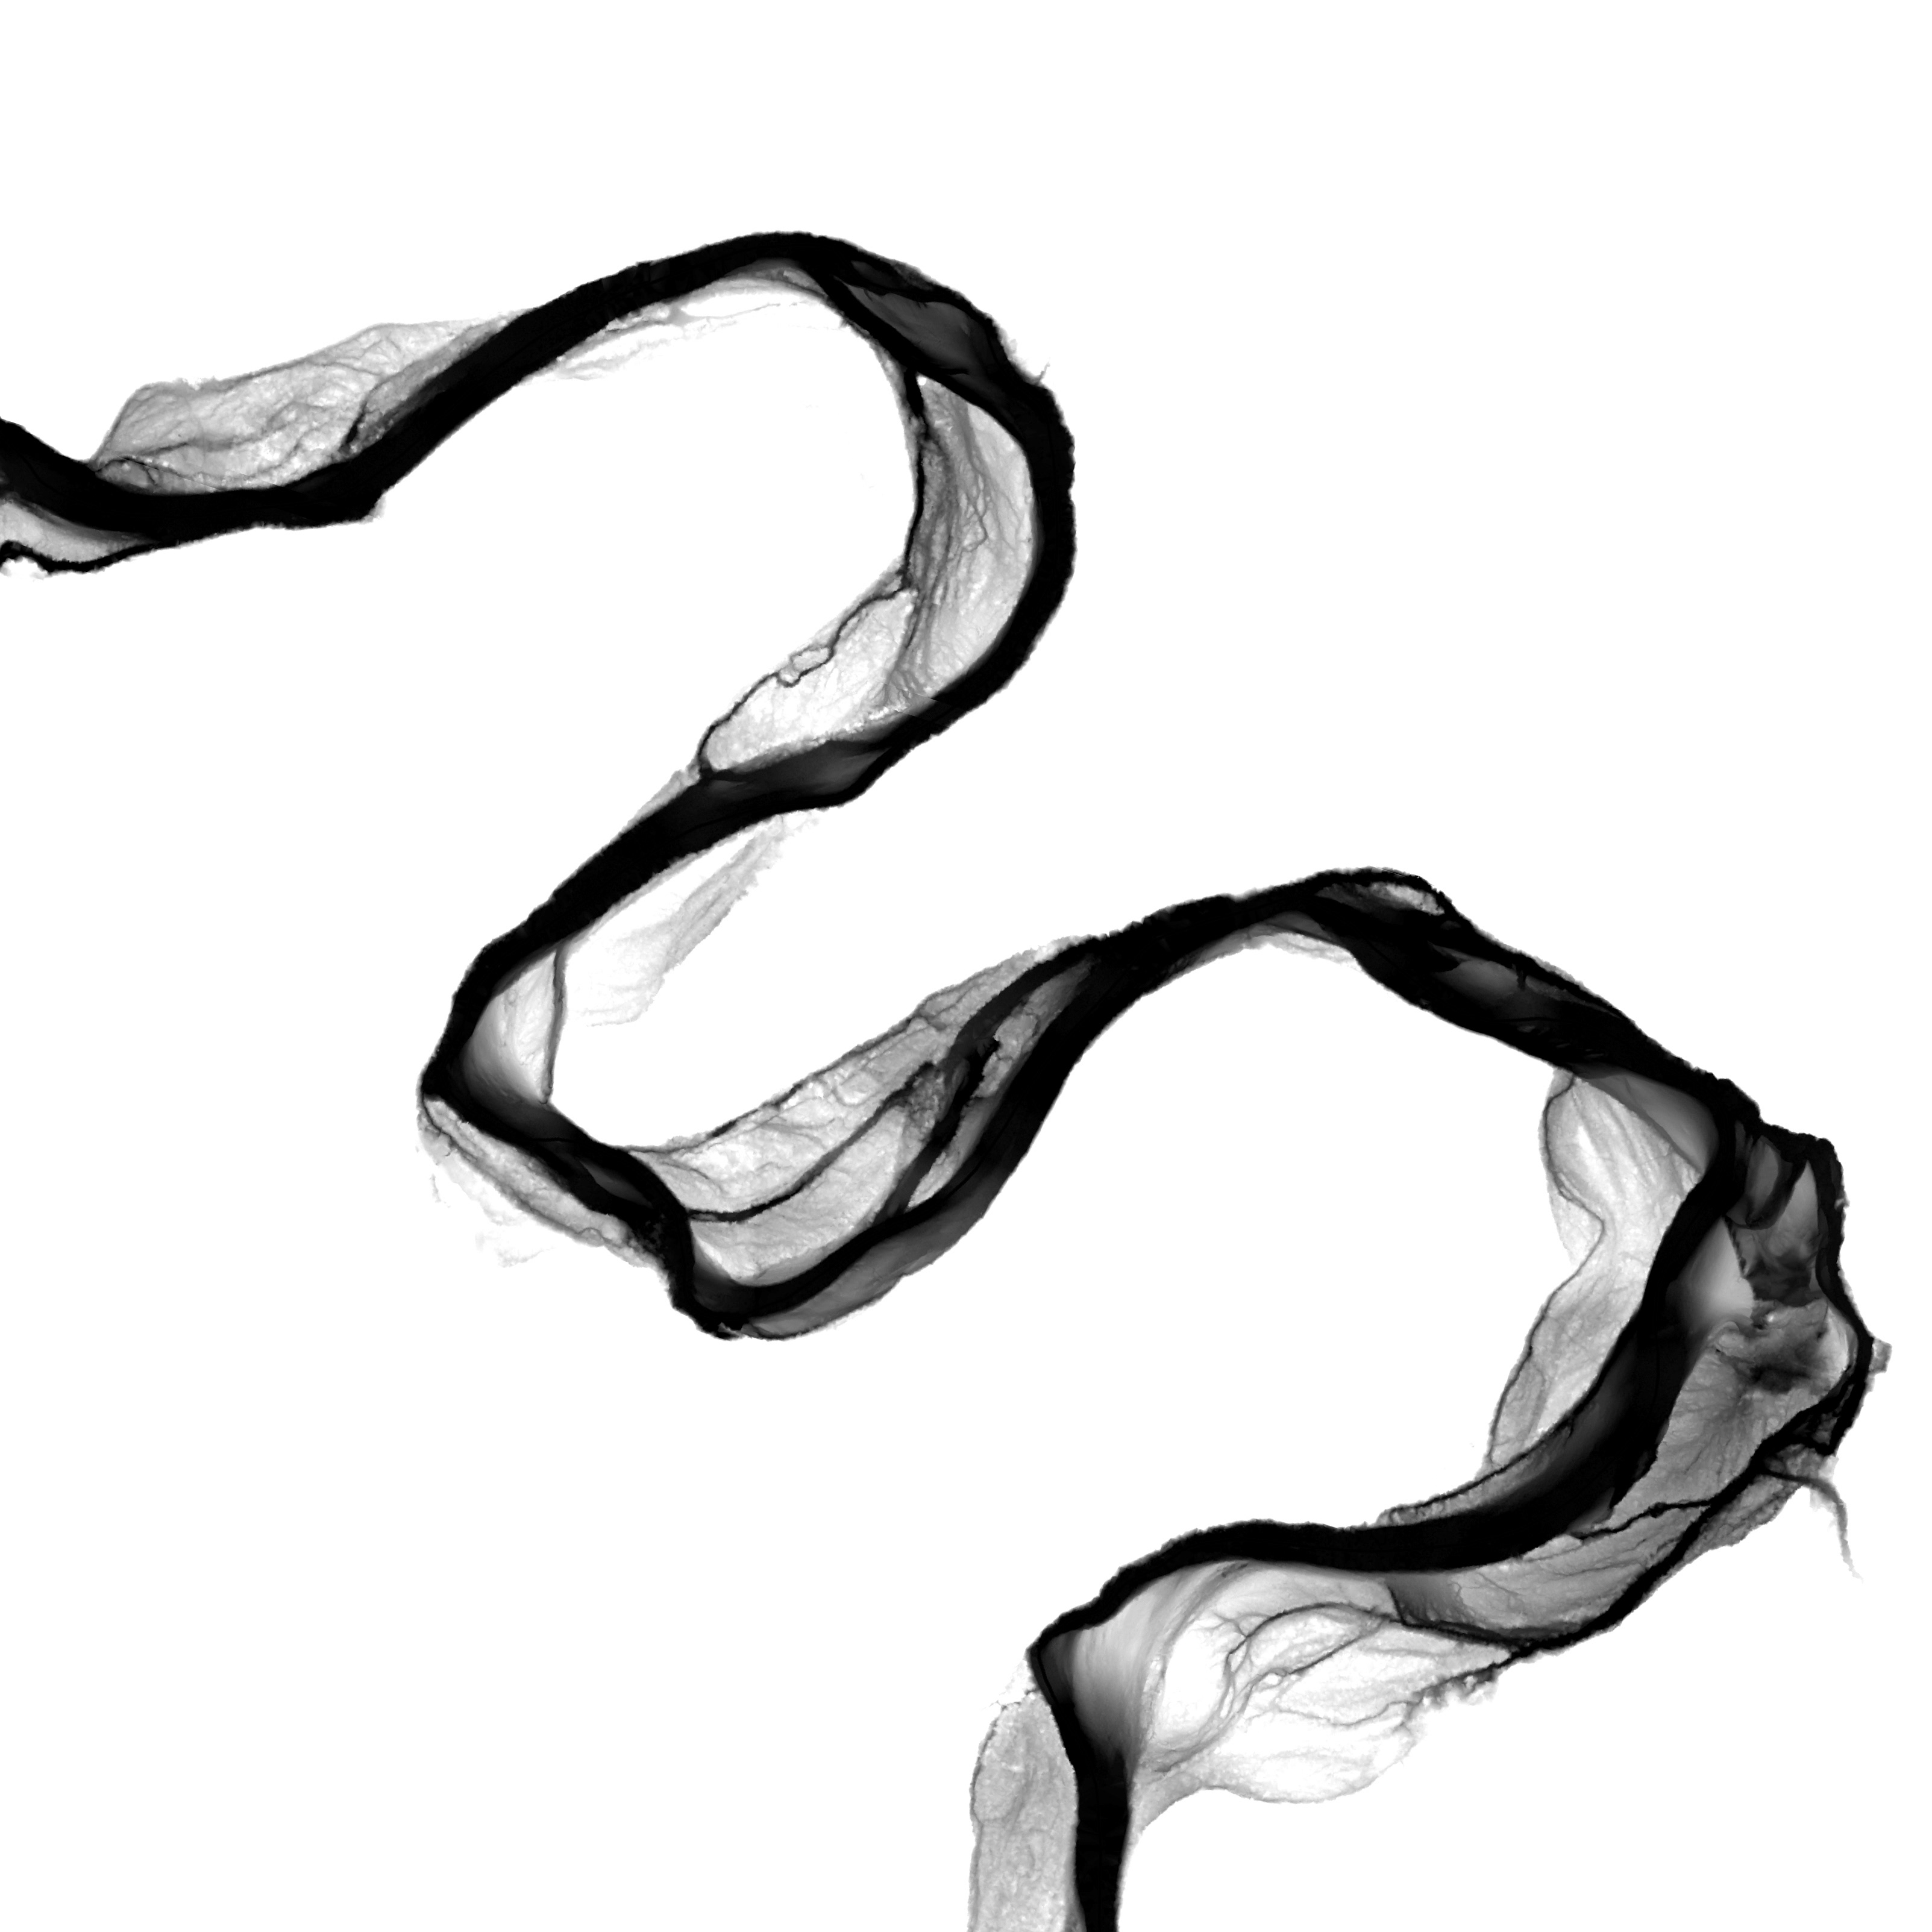
the final result:
I downloaded DEM data from USGS around south central Texas. After downloading the file, I installed the Anaconda package. After a few tweaks to the code, I ran the script. Within a few moments, I had this png:
Open Source Solutions
I am all about open source solutions. On top of open source solutions, I am all about scripting and using automation. With great tools like this, and even greater minds behind them, more questions can be answered. Data that may have not provided us with much, now can be reexamined with new eyes and help us understand the world just a little bit better.


