Creating a 3d Hexmap in Mapbox Studio 🔧

Why a hex map? Aside from providing a more inviting visualization, a hex map has many statistical advantages. Primarily, when it comes to patterns, hexagons are able to interact with more cells helping to paint pictures of trends within the data. Additionally, the hexagon more closely resembles a circle helping to eliminate straight line biases and more accurately showing curved trend lines in data.


So how can you create a simple hex map that you can then display online like this speed bump one I made? It's fairly simple. Full disclosure there are more simplistic ways of doing this however I wanted to use this method as a proof of concept for a bigger vision for hex maps I have.
Getting the Hexes 🍯
The method I chose for this was using a little javascript. My goal in the future is to automate this process so it can be a true data to result web application. For now, I use exports, software, uploads and Mapbox to deliver the final result.
Turf.js is a great library for doing some advanced geospatial analysis. This is how I created the geometry for my web map. After reading this documentation, I saw that I could return a Feature Collection of hex boxes of my desired size and area.
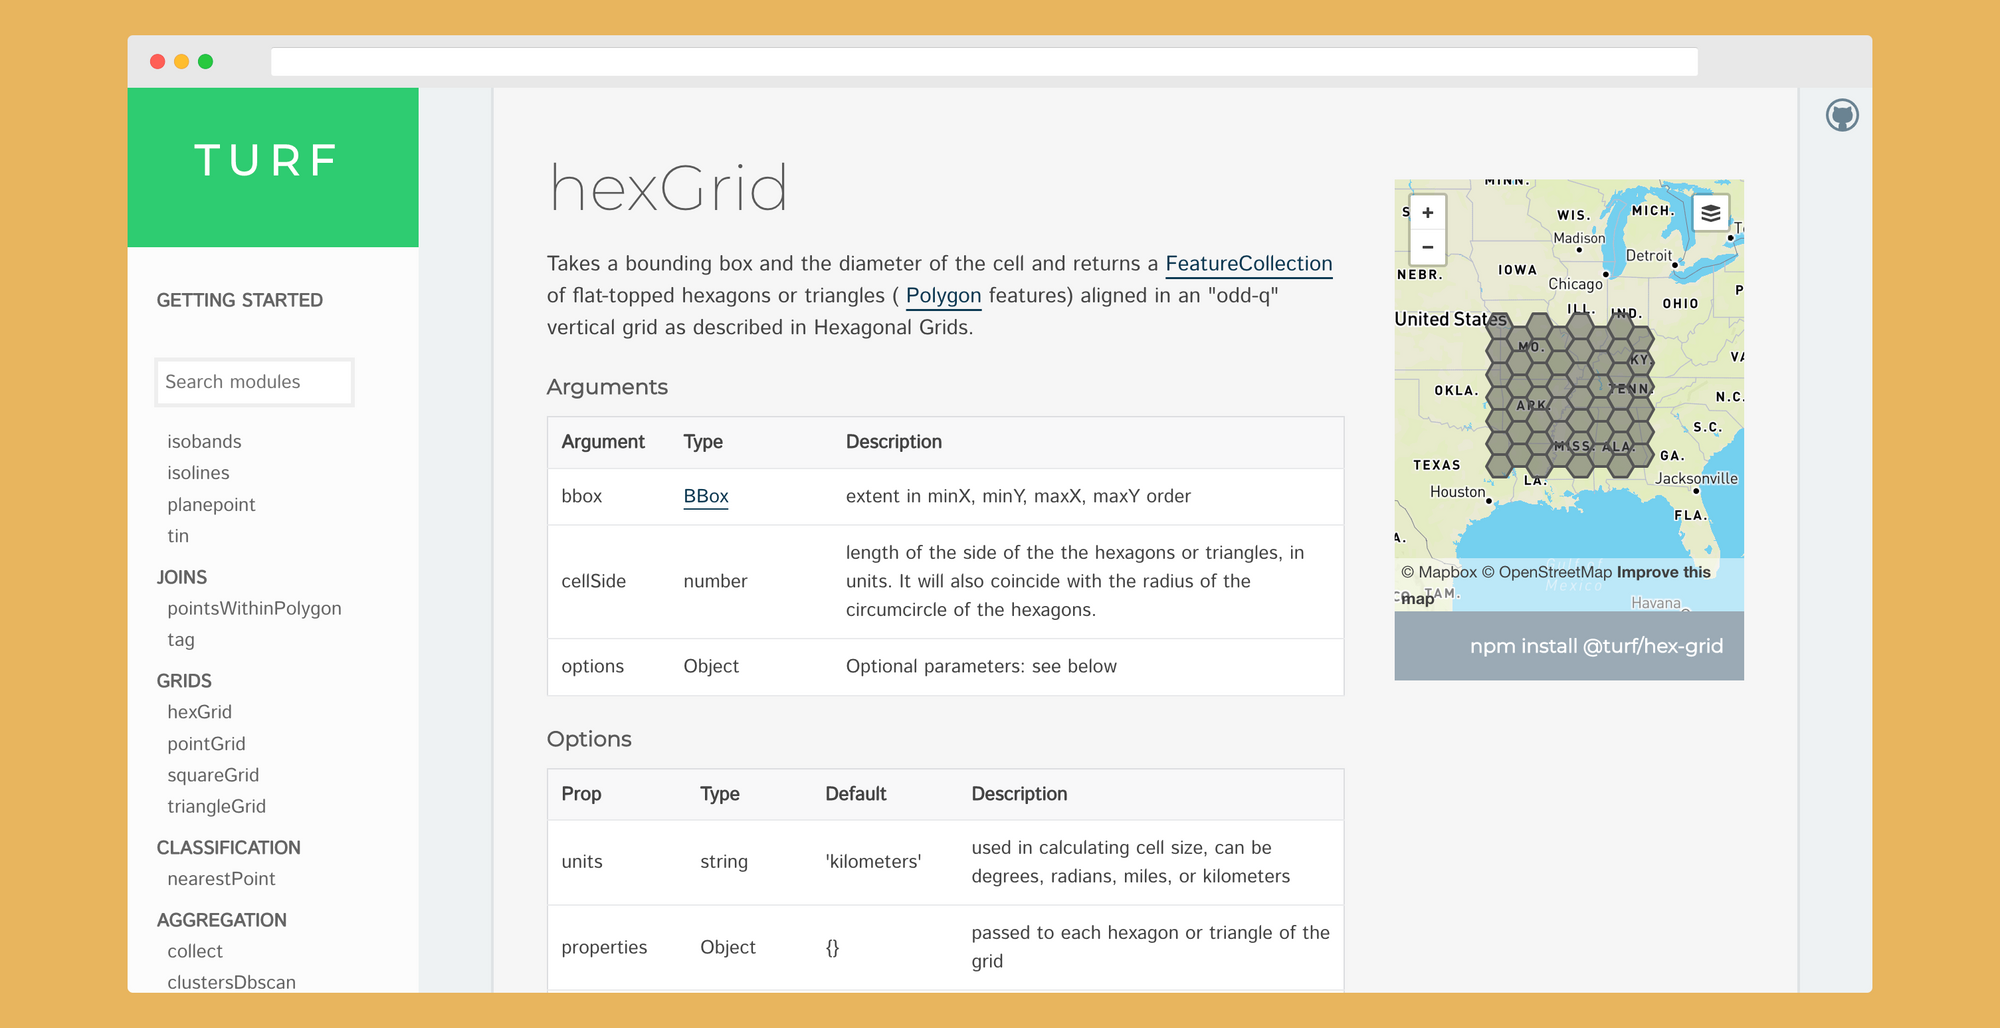
If you want to read more about how to use turf.js to create a hex grid, take a look at the documentation below.
To get you started, I created a small proof of concept git repo for you to see the code in action:
 ShrimpandGits
Perform a Point in Polygon Query 🤝
Next, after using console.log to get the feature collections from my inspector tools, I dowloaded and formatted the two Feature Collections (points and hex) to perform a Point in Polygon Query in QGIS.
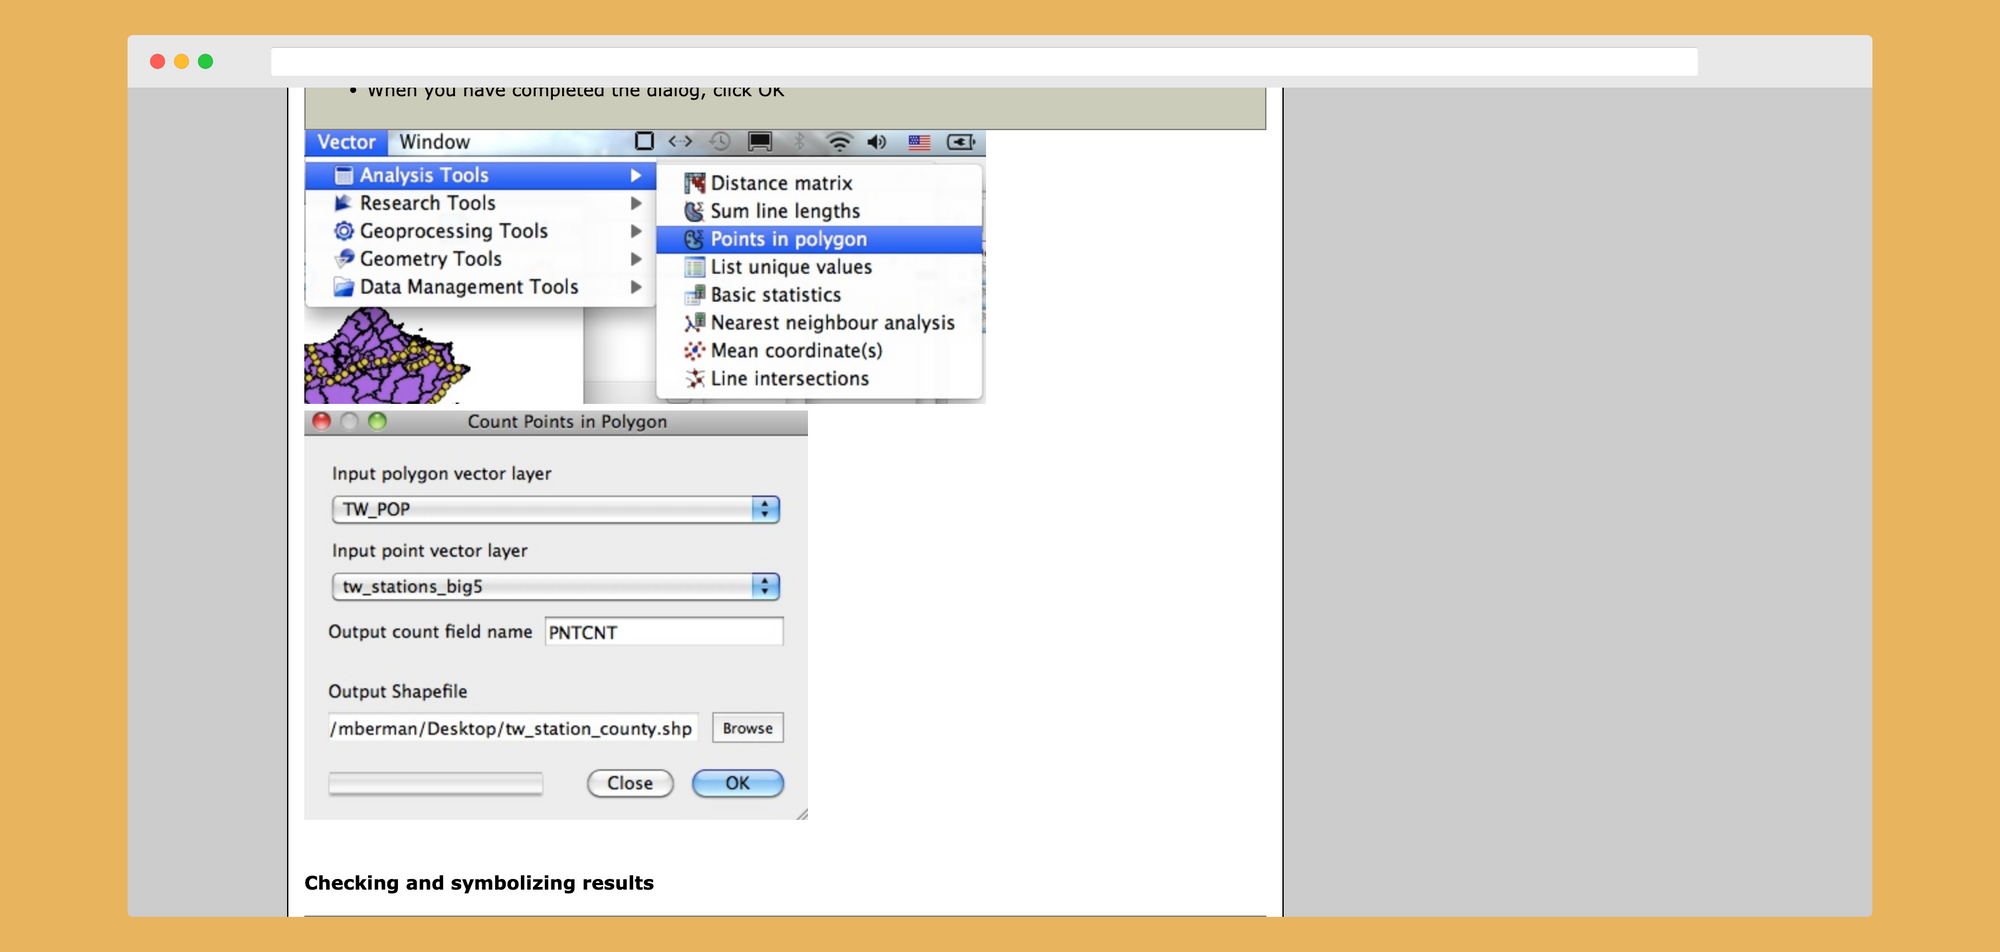
You can follow my tutorial here, but what you should end up with is one singular hex, polygon dataset that contains a field with the number of points inside them.
Upload modified dataset 🪁
After you have done the Point in Polygon Query you will export this as a csv or geojson file within QGIS. Depending on how familiar you are with Mapbox style uploads you might go with CSV as geojson can be funny to upload if you are familiar with it.
Go to your Mapbox studio account and select "create new style".
Choose your basemap and then the "Layers Tab" then "Source" and add or upload your hex file.
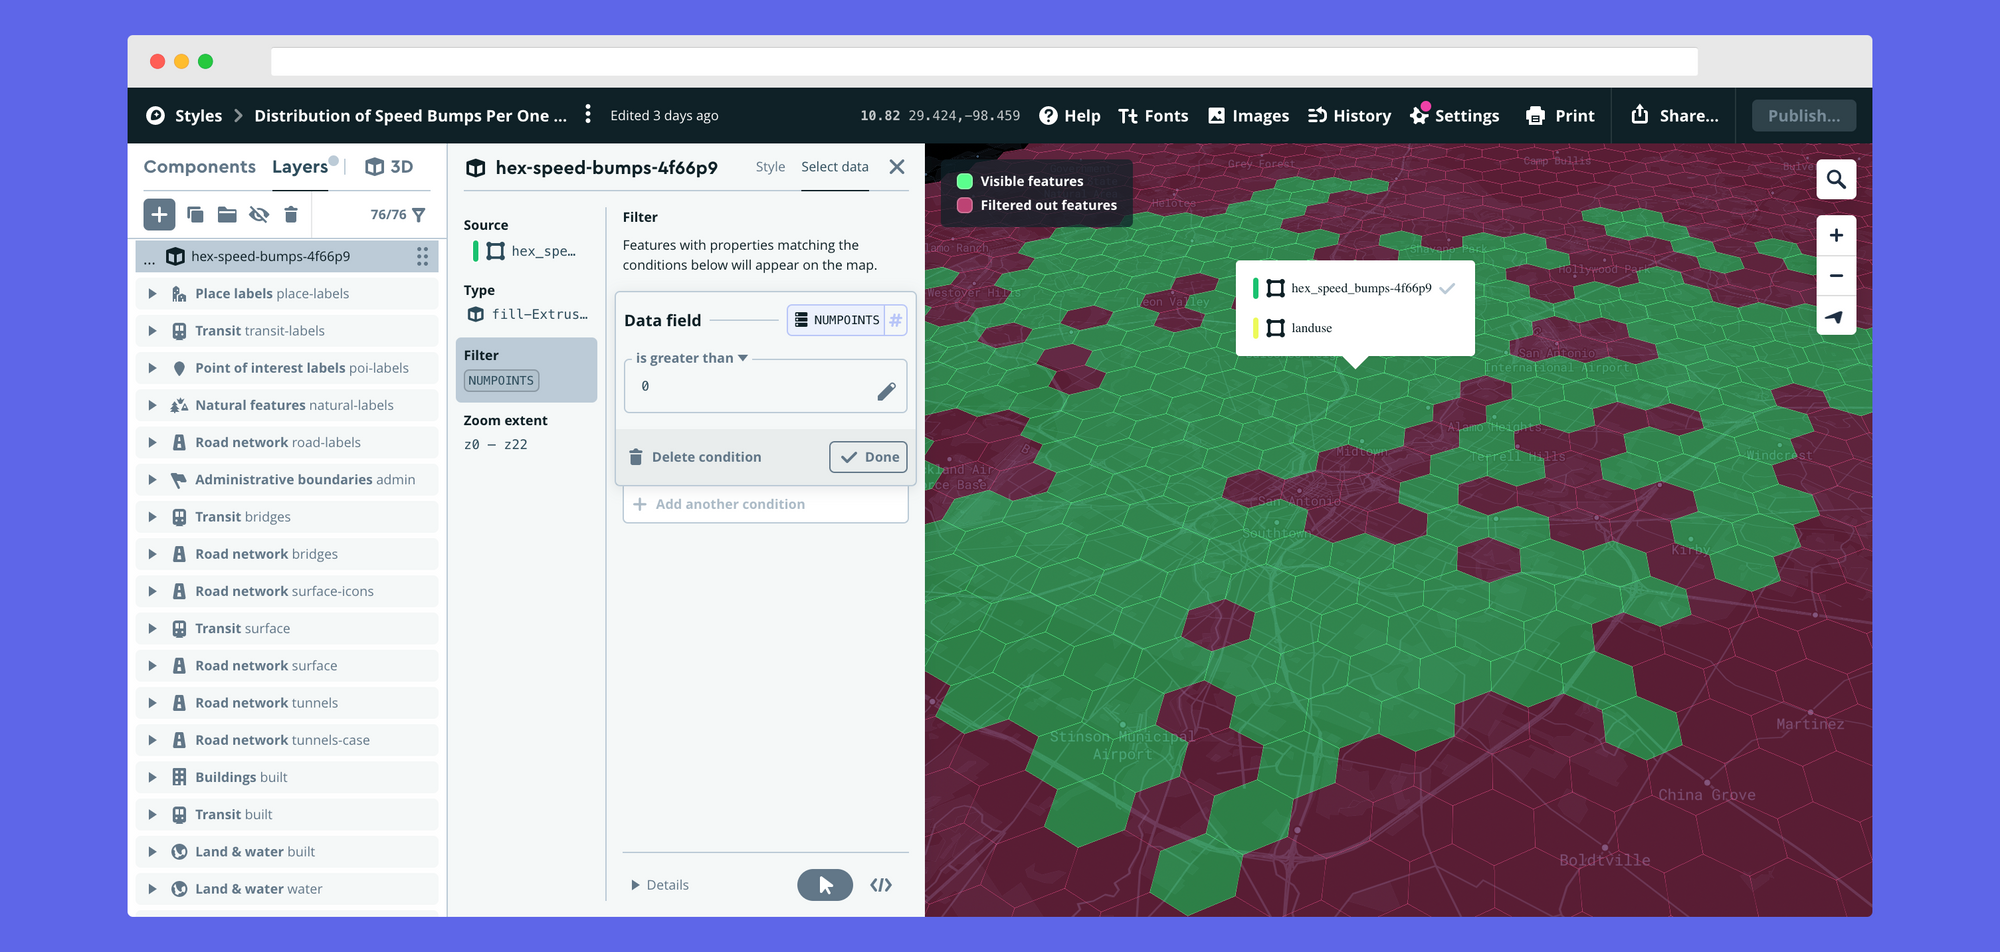
As you can see in the screenshot below, my hex map has been uploaded. But there are a few more steps to make it just right.
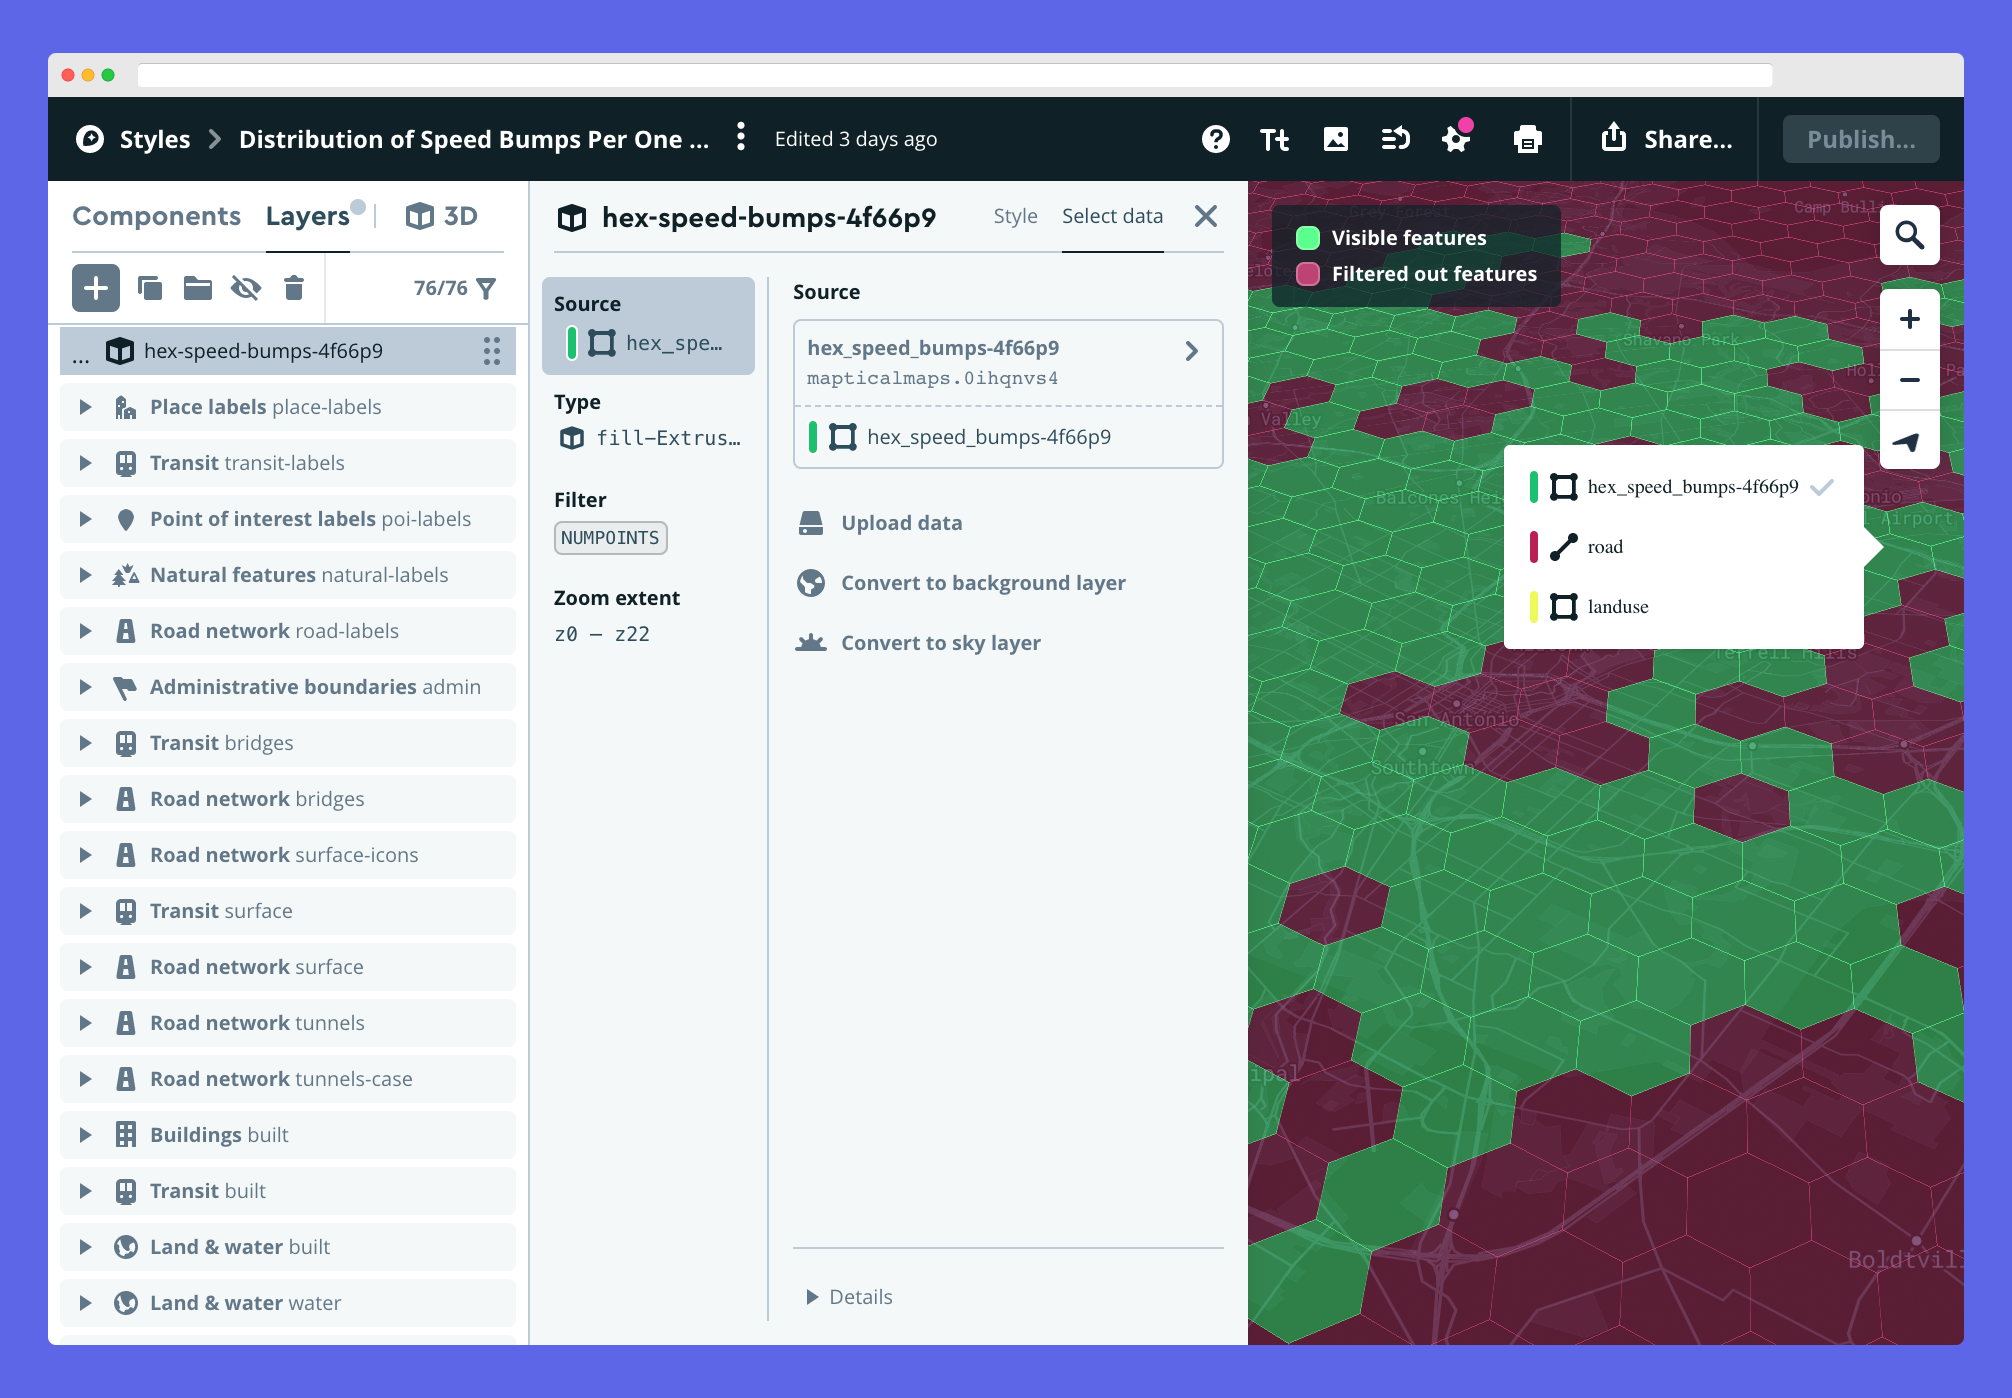
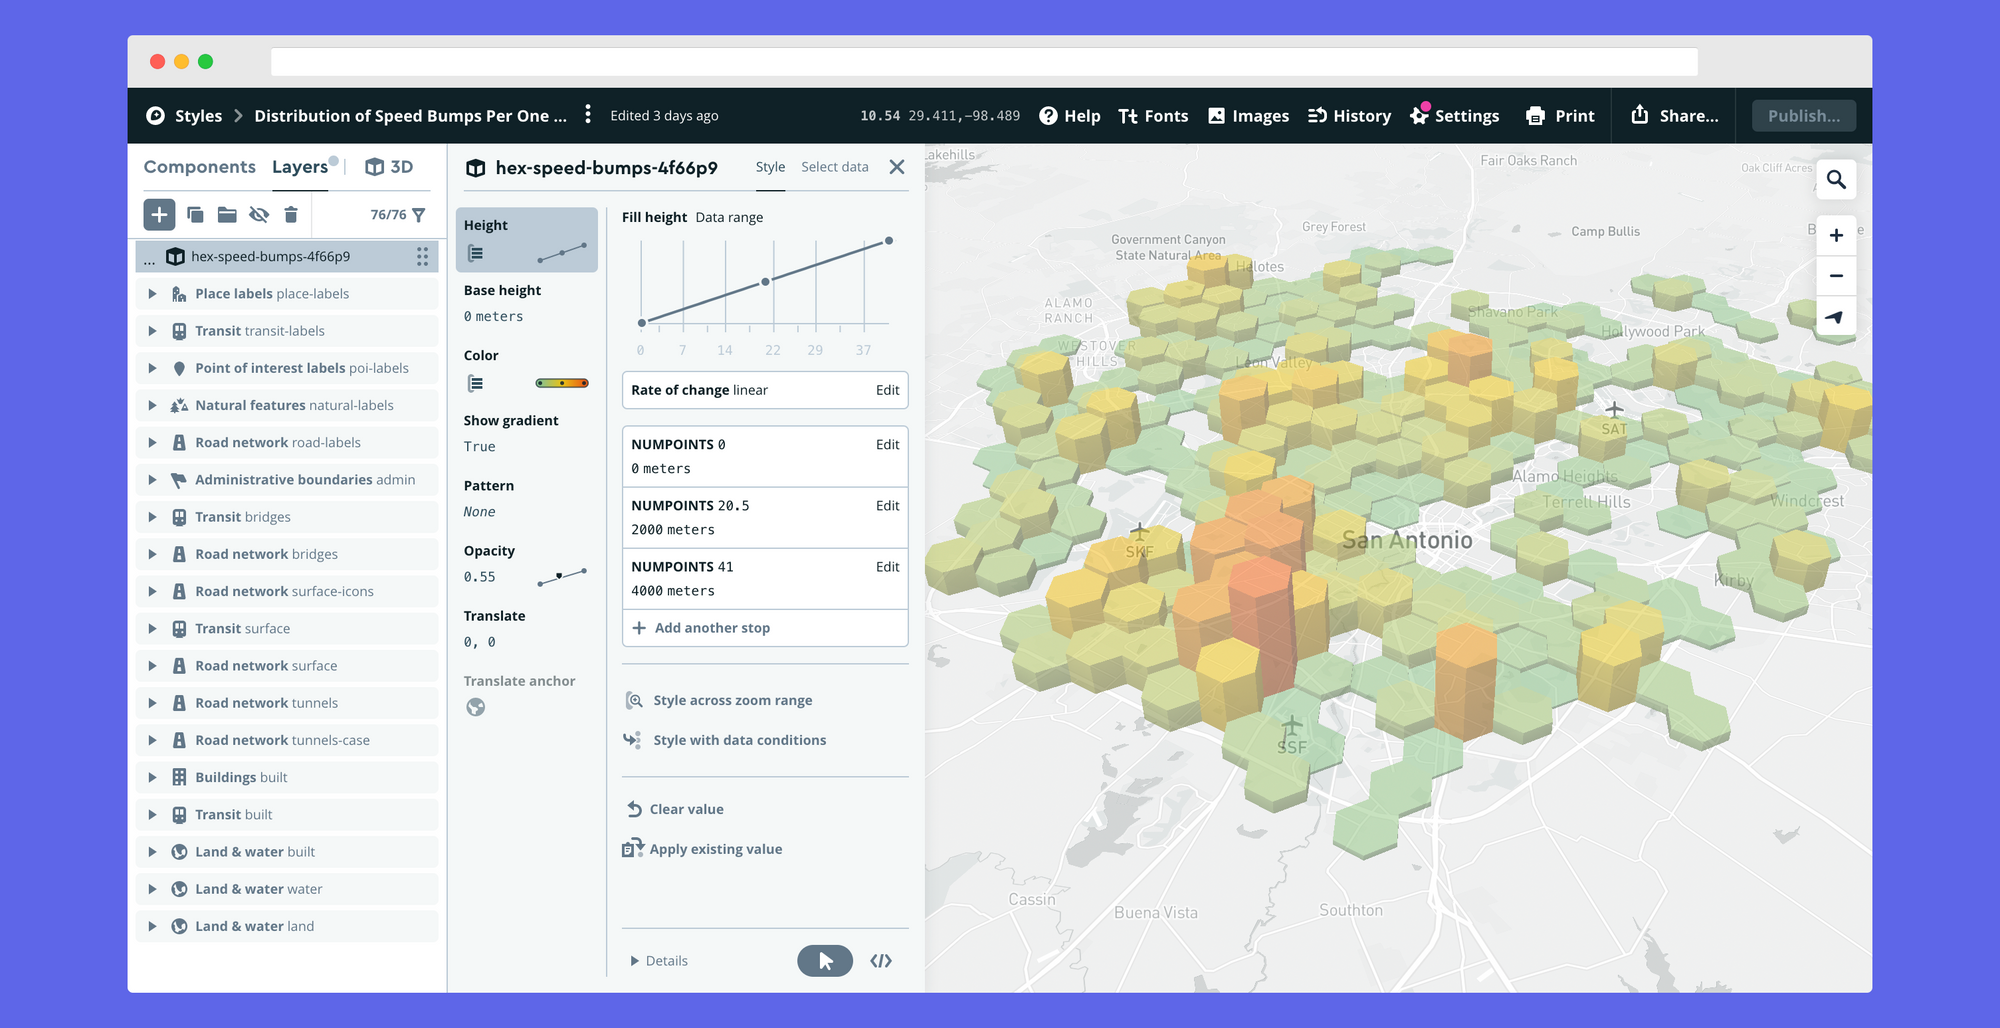
To show the hex values in 3d space I have chosen to use the "Fill Extrusion" option in the Type Tab of Mapbox Studio. There are other options, but for this visualization, I wanted to try something new.
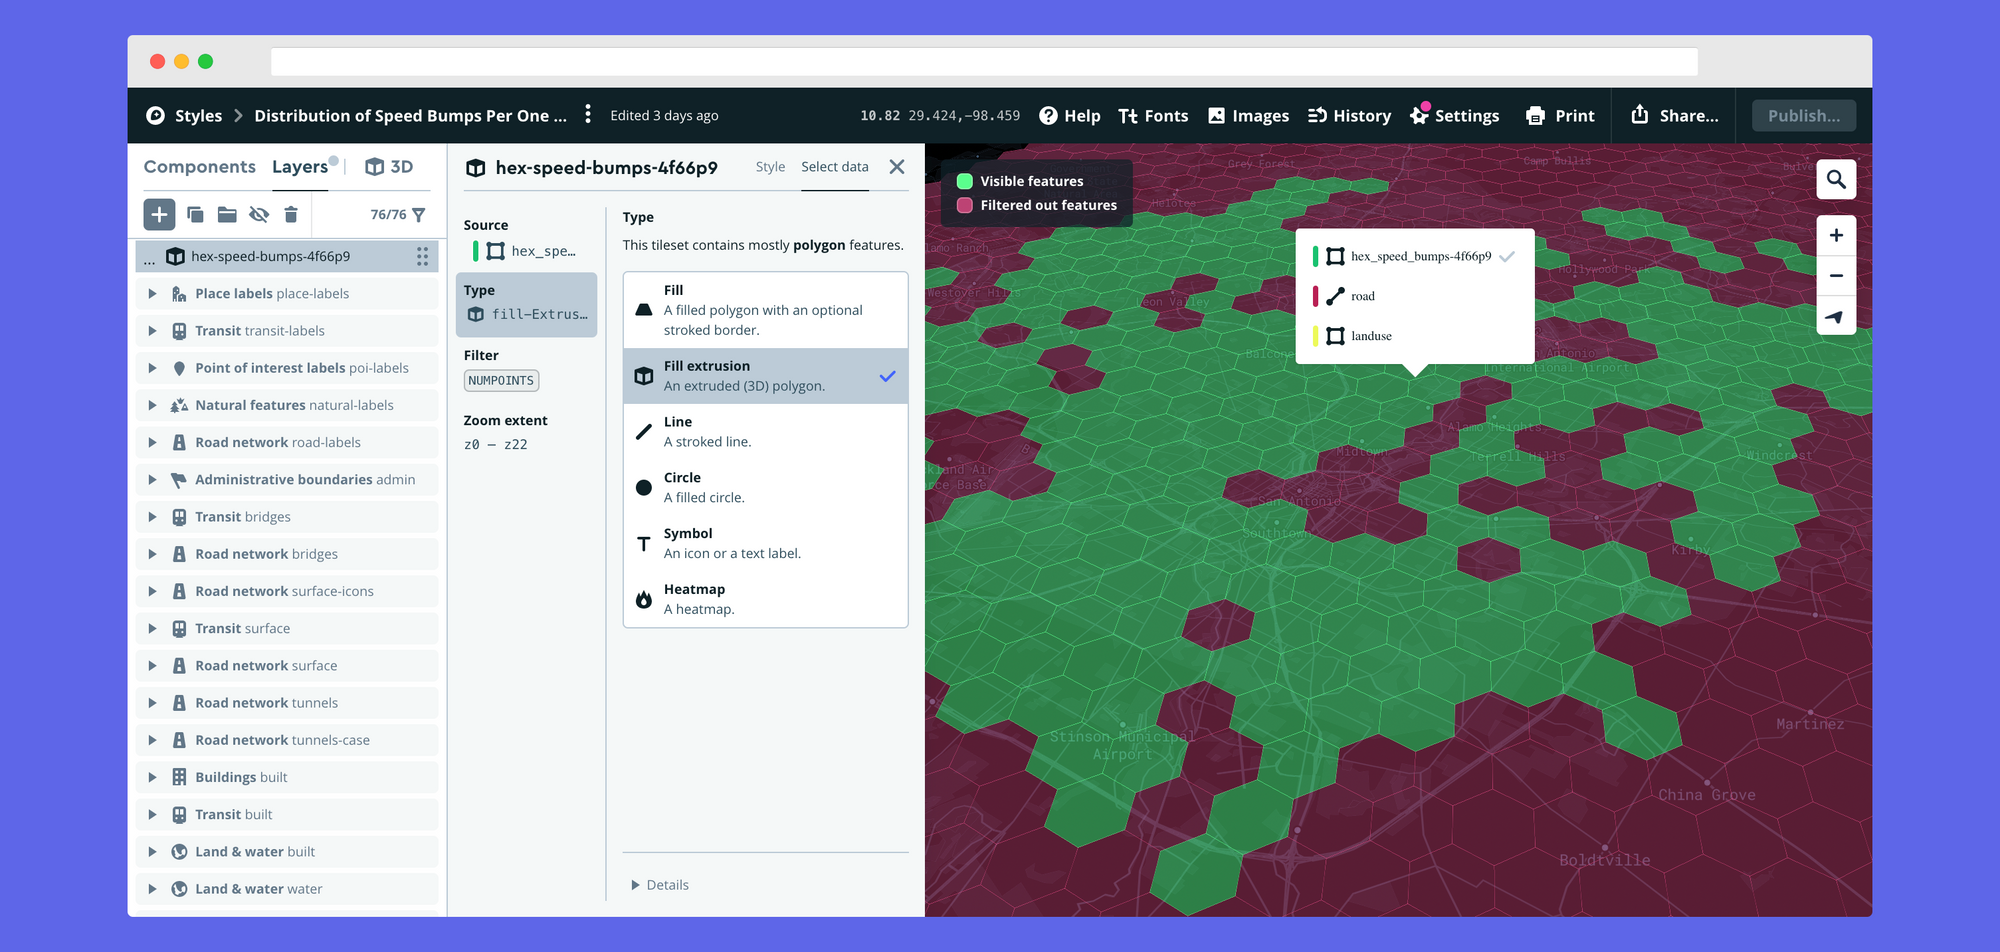
Finally, you might have noticed there are green and red hexagons on the current display. If you look at the legend in the screenshot above you can see the red color means these features are filtered out of the final visualization.
In the Filter Tab, I created one that does into the NUMPOINTS field of my dataset (the field that tells me how many points landed inside my hexagon) and filtered out any value of zero. This cleans up my map visually.
Style in Mapbox Studio 👾
The last part is where you can start having fun with your map. I decided to make a gradient ram, to show where the greatest concentration of speed bumps were found in the city. Then adjusting the ramps and heights to better show meaningful breaks. You can see where all the tabs are places you can get creative and have more freedom to be stylistic.
Now that your style is created you can add this as a basemap layer to your web applications, you can add more data, add interactivity or simply export and share the map with friends.


